Michael Burke: The latest ESRI Quarterly deals very briefly with the issue of economic stimulus.
‘We would be very cautious about a domestic stimulus in Ireland, however funded, as history and experience shows that such a stimulus would have little effect on the domestic economy, but would lead to a worsening of the balance of payments’ (ESRI Summer, QEC, p.41).
Of course, if it were really the case that an Irish stimulus would lead to a worsening of the balance of payments than it would be counter-productive by increasing the overseas indebtedness of the economy, to add to all its other debts.
It should be noted that the ESRI makes no distinction between types of stimulus. Promoting the purchase of goods not at all made in Ireland would be counter-productive, as that could only be met by increased imports. This is what happened with the cut in VRT. But promotion of investment in or purchase of goods wholly or mainly provided in Ireland would not have that effect.
The ESRI also engages in hyperbole when it argues that the experience of the 1950, 1970s and 1980s is that any stimulus measures means a large proportion of stimulus would go to imports. The series of National Development Plans have precisely been a domestic investment stimulus which lifted both the growth rate and the long-term productivity of the economy.
Where Would Stimulus Go?
The assertion that any stimulus would lead to a worsening of the balance of payments is not supported by an analysis of the Input-Output Tables for the Irish economy.
In effect there are distinct categories of sectors in the economy where that would not be the case. The first is comprised of those sectors where the import content of inputs is negligible. This means that any increase in the output of these sectors would require no increase in imports. The second category of sectors includes those where the export output is much higher than the import content. This means that firms based in Ireland are importing lower value goods or services and re-exporting them having added significant value to them. The third category is comprised of those sectors where, even though the import content of inputs are high, the domestic multiplier effect is so large as to produce a significant boost to the domestic economy.
The first category is where import content of inputs is low. As the CSO says (p.10), of 53 sector groups there are 7 which have an import multiplier of less than 0.15, that is for every €1 extra of domestically produced output in these sectors, less than 15 cents is required indirectly in imports. These include wholesale trade, real estate services and education, motor repair, retail trade and repair of household goods. Health services have in import multiplier of just 0.16. Investment in these areas would overwhelmingly boost the domestic economy.
The second category is comprised of those sectors where the export component of output is much greater than import inputs. They are naturally dominated by the sectors in which the overseas multinationals predominate, printed materials, chemical products, office machinery and financial intermediation. But that is not exclusively the case, as the manufacture of food and beverages and the wholesale sectors both export more than they import. Providing services or ancillary inputs to those MNC-dominated sectors, or investment in the two large indigenous exporting sectors would be a positive for the balance of payments, as well as boosting output and employment. Altogether there are 27, of 53, product categories where higher value added means they export more than they import.
In the third category are those sectors where the boost to the economy from increased investment (the ‘multiplier effects’) are so great as to override concerns regarding import content. There are also 7 out of 53 sector groups where the output multiplier is 1.66 or greater (pp. 38-40), implying that the State would have a direct positive return on investment in these areas. These include agriculture, food and beverage manufacturing, water collection and distribution, construction, hotels and restaurants and water transport. The state could either directly invest in these (eg, water distribution and collection, construction/refurbishment of schools) or facilitate investment (eg, through promotion of tourism to benefit hotels and restaurants) and provide a positive return to the Exchequer. Indeed, in the case of tourism promotion, it would make sense for the overwhelming bulk of the investment to be made overseas.
The truisms regarding Ireland’s status as a small, open economy should not obscure the potential for State-led investment in a wide range of product sectors which have little import content, or whose domestic impact is so great as to render the objection that there will e increased import demand meaningless.
In fact, we could go further and argue that the ESRI’s entire framework is wrong. If the aim of policy were to prevent imports then there are numerous examples internationally and in Ireland’s own history where everything from import-substitution to autarky where that has been tried and failed.
27 of the 53 product sectors in the Irish economy export more than they import. Investing in those sectors, either directly or indirectly would boost imports, but exports would grow by a greater amount. Even those sectors which currently export nothing according to the CSO, like education, could become significant exporters by attracting overseas students. There is a vast and growing demand for high value-added education primarily in English and, as coverage of Euro2012 shows, everyone likes the Irish. But that too would require state-led investment and the input of high-value imports, both material and human.

Showing posts with label esri. Show all posts
Showing posts with label esri. Show all posts
Wednesday, 20 June 2012


Wednesday, 13 June 2012
The Costs of Working in Ireland
Nat O'Connor: The ESRI withdrew a working paper today. The Irish Times reported that this was "unprecedented". However, another ESRI report (on waste incineration) was being "re-examined" by the ESRI last year, so it is not completely unheard of.
Working in a think-tank that also publishes discussion papers that are the author's sole responsibility, I have a certain sympathy for the ESRI's position. The whole point about working papers - and the Cost of Working piece was just that, not a 'report' as The Irish Times claims - is that they are open for discussion and debate, and there is an opportunity for new information and new analysis to influence the author's thinking before a final version is produced. Taken to a logical extreme, it is always possible that working papers in the social sciences are simply wrong. The margin of error in statistical analysis always allows for a few lemons. But this is not always obvious and we need the publication of more, and more diverse, analysis in Ireland, not less.
The pity about this brief storm is that the withdrawal of the paper will focus more attention on its uncertain conclusions than if it was quietly ignored. It's worth noting a couple of things about the paper. (I found a copy here: http://www.rte.ie/news/2012/0612/esri_report.pdf).
First of all, the data is from the 2004/05 Household Budget Survey, at a time when we had practically full employment in Ireland. While the 'incentives' might seem to have made moving from welfare to work unattractive, the fact was that practically everyone was actually working and many people left welfare to take up employment. This somewhat deflates the central argument of the paper.
The paper rightly points out the fact that childcare costs are extremely high and that they - and other costs - are a barrier to people entering work. There is no doubt that there is a weight of evidence that people, especially women, are put off from entering the labour market because of the costs of childcare. People parenting alone are particularly affected by this.
But the paper does not examine other costs, and factors that offset these costs. For example, housing costs are a major factor. People who gain employment will lose Rent Supplement, whereas people living in local authority social housing can maintain their lower-than-average 'differential rent' when they gain employment. (Differential rent is not a bad thing, as cheaper rent makes it possible for some people to take lower paid employment). In other words, there are lots of major variables not examined in the paper that change the incentives about working.
Moreover, are economists better placed than psychologists to explain why people go to work? During the boom period, some people went to work for marginal benefit, when costs like childcare are factored in. However, people work in order to maintain social networks, for a sense of personal independence and for lots of other reasons. Looking only at a set of short-term cash 'incentives' won't tell the whole story.
Finally, there are other important factors to be examined. NERI point out that the ratio of people unemployed to job vacancies in Ireland is the second worse in the EU. In other words, there are far more people looking for work than there are jobs, and no amount of changing incentives is going to improve that. The real focus should be on boosting demand in the economy to generate more employment opportunities.
Working in a think-tank that also publishes discussion papers that are the author's sole responsibility, I have a certain sympathy for the ESRI's position. The whole point about working papers - and the Cost of Working piece was just that, not a 'report' as The Irish Times claims - is that they are open for discussion and debate, and there is an opportunity for new information and new analysis to influence the author's thinking before a final version is produced. Taken to a logical extreme, it is always possible that working papers in the social sciences are simply wrong. The margin of error in statistical analysis always allows for a few lemons. But this is not always obvious and we need the publication of more, and more diverse, analysis in Ireland, not less.
The pity about this brief storm is that the withdrawal of the paper will focus more attention on its uncertain conclusions than if it was quietly ignored. It's worth noting a couple of things about the paper. (I found a copy here: http://www.rte.ie/news/2012/0612/esri_report.pdf).
First of all, the data is from the 2004/05 Household Budget Survey, at a time when we had practically full employment in Ireland. While the 'incentives' might seem to have made moving from welfare to work unattractive, the fact was that practically everyone was actually working and many people left welfare to take up employment. This somewhat deflates the central argument of the paper.
The paper rightly points out the fact that childcare costs are extremely high and that they - and other costs - are a barrier to people entering work. There is no doubt that there is a weight of evidence that people, especially women, are put off from entering the labour market because of the costs of childcare. People parenting alone are particularly affected by this.
But the paper does not examine other costs, and factors that offset these costs. For example, housing costs are a major factor. People who gain employment will lose Rent Supplement, whereas people living in local authority social housing can maintain their lower-than-average 'differential rent' when they gain employment. (Differential rent is not a bad thing, as cheaper rent makes it possible for some people to take lower paid employment). In other words, there are lots of major variables not examined in the paper that change the incentives about working.
Moreover, are economists better placed than psychologists to explain why people go to work? During the boom period, some people went to work for marginal benefit, when costs like childcare are factored in. However, people work in order to maintain social networks, for a sense of personal independence and for lots of other reasons. Looking only at a set of short-term cash 'incentives' won't tell the whole story.
Finally, there are other important factors to be examined. NERI point out that the ratio of people unemployed to job vacancies in Ireland is the second worse in the EU. In other words, there are far more people looking for work than there are jobs, and no amount of changing incentives is going to improve that. The real focus should be on boosting demand in the economy to generate more employment opportunities.
Friday, 24 February 2012
'Austerity is working' - not
Tom Healy: In its latest Quarterly Economic Commentary the ESRI QEC authors observe that 'The euro zone economy is slipping into recession due to the impact of both the austerity measures and the effect of policy uncertainty in the euro zone on investment, consumer spending and employment.'
Nothing surprising there. Most commentators expect a flatlining in the EZ economy at best and a new recession at worst - thanks to a combination of factors including coordinated pan-European fiscal austerity. The QEC goes on to say that
'The austerity measures currently being undertaken, and those implemented over the past four years, are having an impact, as evidenced by the improvement in the public finances. However, while these measures correct the public finances they have a dampening effect on economic activity.'
Following €25bn in discretionary fiscal adjustments since 2008 the public sector deficit is still above 10% of GDP, down from 11.8% previously.
Evidence that it is dampening economic activity is the projection by the QEC that private consumer spending will decline in real terms of 1.8% this year and invetment will decline by 3.3%. No hope there for a turnround in the domestic economy any time soon. The QEC projects a further contraction in the domestic economy in 2013. Contrast that with the latest Economic and Fiscal Outlook by the Department of Finance in November which had no volume change in private consumer spending and a 3.2% increase in investment in 2013. It will be argued that the slowdown in internatinal trade explains the downgrading of economic forceasts more generally. But the truth is that the domestic economy is continuing to contract at a faster rate than had been forecasted and all the signals are that fiscal austerity in recent Budgets have driven that decline.
But, the QEC comments as do most economic commentators at least within Ireland that 'there is no other way':
There are very few policy options open to the government to stimulate growth as the traditional instruments of macro policy are either not available (monetary and exchange rate policy) or completely constrained (fiscal policy).
This line is accepted uncritically by most mainstream economic and media commentators. Next month a new economic research institute established under the umbrella of the ICTU will challenge that view and propose an alternative focussed on growth-enhancing strategic investment in much-needed infastructural development.
Nothing surprising there. Most commentators expect a flatlining in the EZ economy at best and a new recession at worst - thanks to a combination of factors including coordinated pan-European fiscal austerity. The QEC goes on to say that
'The austerity measures currently being undertaken, and those implemented over the past four years, are having an impact, as evidenced by the improvement in the public finances. However, while these measures correct the public finances they have a dampening effect on economic activity.'
Following €25bn in discretionary fiscal adjustments since 2008 the public sector deficit is still above 10% of GDP, down from 11.8% previously.
Evidence that it is dampening economic activity is the projection by the QEC that private consumer spending will decline in real terms of 1.8% this year and invetment will decline by 3.3%. No hope there for a turnround in the domestic economy any time soon. The QEC projects a further contraction in the domestic economy in 2013. Contrast that with the latest Economic and Fiscal Outlook by the Department of Finance in November which had no volume change in private consumer spending and a 3.2% increase in investment in 2013. It will be argued that the slowdown in internatinal trade explains the downgrading of economic forceasts more generally. But the truth is that the domestic economy is continuing to contract at a faster rate than had been forecasted and all the signals are that fiscal austerity in recent Budgets have driven that decline.
But, the QEC comments as do most economic commentators at least within Ireland that 'there is no other way':
There are very few policy options open to the government to stimulate growth as the traditional instruments of macro policy are either not available (monetary and exchange rate policy) or completely constrained (fiscal policy).
This line is accepted uncritically by most mainstream economic and media commentators. Next month a new economic research institute established under the umbrella of the ICTU will challenge that view and propose an alternative focussed on growth-enhancing strategic investment in much-needed infastructural development.
Wednesday, 7 September 2011
The more things don't change, the more things don't
Michael Taft: The ESRI has produced a report on deficit and debt levels up to 2015 which has moved many to claim if we just stay the austerity course we will emerge from the forest of fiscal dark into the valley of economic repose. If you haven’t yet, first read Michael Burke’s critique of the ESRI report Here, I want to focus on a small little item (which is actually a big item): their assumptions on growth.
Read the rest of the post here:
Read the rest of the post here:
Austerity is not working
Paul Sweeney: As Michael Burke says in his post yesterday, the ESRI’s forecast is based on some outstanding optimism. It seems that the Institute has turned into a surprisingly optimistic body. The fragrant air it is breathing is not in Ireland. Those exports will have to do a lot more “heavy lifting” to compensate for the 21% collapse in domestic demand over the past three years.
There is more realism abroad. Here is an interview with the FT’s Martin Wolf on Austerity vs Stimulus. It is part of that paper’s debate on the subject. Unlike most of the Irish media, the FT gives two sides. Wolf in an article says Britain is in the worst depression since the Great Depression of the 1930s. I’m sure the figures are similar for Ireland. The 1950s were bad, but were they as bad as now on the length and especially the depth of the Depression? I suspect so, but don’t have the data.
He is quite critical of policy and thinks “the forecasts are hopelessly rosy”. He says we are heading for “a historic disaster.”
Also, Wolfgang Munchau of the same paper, the FT, had a piece on Monday 5th September which argued that the worst of the crisis is yet to come. Why? Because “all countries are deflating simultaneously.”
And even small Ireland contributes to this downward spiral. There is a growing nationalism in the Irish business and economic establishment which is developing further in response to the crisis. It is a “beggar thy neighbour” attitude on our exports doing the “heavy lifting.” This Green Jersey line is similar to the establishment’s autarkic view of our low corporation tax.
Munchau argues that “The very least one should expect is for the eurozone to abandon all austerity programmes with immediate effect and to return to a fiscally neutral stance, allowing the automatic stabilisers to kick in fully.”
He continues: “At present, such a shift is not even on the agenda. As is so typical in the eurozone, each country behaves like a small open economy at the edge of the world. Each assumes its actions have no impact on the others.”
On the opposite side, we have German Finance Minister Wolfgang Schauble of Germany arguing for Austerity. Here we have John Fitzgerald, Philip Lane and most Irish academics arguing for more Austerity. Interestingly, however, on the ground, groups like Congress and IBEC are argueing for less austerity in the forthcoming Budget. If we go for a package of as high as €4bn, there will be no growth (GNP) again next year, the fifth year of our Depression!
Munchau concludes by saying that, when the downturn hits the eurozone, the crisis will “turn ugly.”
Ugly? Looking out the window I see “real ugly” already. If our soothsayers have their way, Ireland’s Five Year Depression will become like Japan’s – A Ten Year Depression!
What is really surprising is that the penny has not dropped yet on the ineffectiveness of the Irish Austerity Programme. It will have taken a staggering €20.6bn out of the economy by year end. All indicators show it is much too severe and is killing off domestic demand. To take a further €4bn our in the next Budget, as the Macho Economists demand, will be real folly.
It should be far less and must include a real “Jobs Programme.” It will cost money, but we have some left in our Pension Fund.
There is more realism abroad. Here is an interview with the FT’s Martin Wolf on Austerity vs Stimulus. It is part of that paper’s debate on the subject. Unlike most of the Irish media, the FT gives two sides. Wolf in an article says Britain is in the worst depression since the Great Depression of the 1930s. I’m sure the figures are similar for Ireland. The 1950s were bad, but were they as bad as now on the length and especially the depth of the Depression? I suspect so, but don’t have the data.
He is quite critical of policy and thinks “the forecasts are hopelessly rosy”. He says we are heading for “a historic disaster.”
Also, Wolfgang Munchau of the same paper, the FT, had a piece on Monday 5th September which argued that the worst of the crisis is yet to come. Why? Because “all countries are deflating simultaneously.”
And even small Ireland contributes to this downward spiral. There is a growing nationalism in the Irish business and economic establishment which is developing further in response to the crisis. It is a “beggar thy neighbour” attitude on our exports doing the “heavy lifting.” This Green Jersey line is similar to the establishment’s autarkic view of our low corporation tax.
Munchau argues that “The very least one should expect is for the eurozone to abandon all austerity programmes with immediate effect and to return to a fiscally neutral stance, allowing the automatic stabilisers to kick in fully.”
He continues: “At present, such a shift is not even on the agenda. As is so typical in the eurozone, each country behaves like a small open economy at the edge of the world. Each assumes its actions have no impact on the others.”
On the opposite side, we have German Finance Minister Wolfgang Schauble of Germany arguing for Austerity. Here we have John Fitzgerald, Philip Lane and most Irish academics arguing for more Austerity. Interestingly, however, on the ground, groups like Congress and IBEC are argueing for less austerity in the forthcoming Budget. If we go for a package of as high as €4bn, there will be no growth (GNP) again next year, the fifth year of our Depression!
Munchau concludes by saying that, when the downturn hits the eurozone, the crisis will “turn ugly.”
Ugly? Looking out the window I see “real ugly” already. If our soothsayers have their way, Ireland’s Five Year Depression will become like Japan’s – A Ten Year Depression!
What is really surprising is that the penny has not dropped yet on the ineffectiveness of the Irish Austerity Programme. It will have taken a staggering €20.6bn out of the economy by year end. All indicators show it is much too severe and is killing off domestic demand. To take a further €4bn our in the next Budget, as the Macho Economists demand, will be real folly.
It should be far less and must include a real “Jobs Programme.” It will cost money, but we have some left in our Pension Fund.
Tuesday, 6 September 2011
This time, it's different
Michael Burke: The ESRI’s latest research paper, ’Irish Government Debt and Implied Debt Dynamics: 2011-2015’ has received much coverage. Commentary has focused on the projected stabilisation of the overall debt in relation to the economy; the debt/GDP ratio or the debt/GNP ratio. From this, some more excitable commentary has suggested that this is a vindication of the broad-based attack on living standards, increased taxes on working people (but not on corporates) and public spending cuts euphemistically known as ‘austerity’ policies.
However, this last contention, that ‘austerity works’, is not supported by the authors’ findings themselves. To quote their own summary of their paper, ‘[Our projected debt ratios are] much lower than had been projected in official figures earlier in the year, partly because the cost of the bank recapitalisation was much lower than anticipated and also because of the reduction in EU interest rates’.
So, the lower projections are based on the lower level of bank recapitalisation and lower rates for bailout funds for those recapitalisations. According to the authors’ abstract of their own findings, none of the projected improvement is attributable to ‘austerity’ measures.
Quality of Forecasts
But how ‘good’ are these forecasts, in both senses? First, what is the quantum of improvement that is being forecast by the ESRI? Secondly, how likely is it that these forecasts will prove correct? The debt ratios forecast by the ESRI are set out in the table below:
Debt Ratios, % GDP

Source: ESRI, Eurostat, IMF databank, Euro Area Spring Forecasts
The first point to note is that the ESRI is not projecting any reduction in the level of government debt over the period 2010 to 2015. Over that period, debt will rise from 94.9% of GDP to a projected 106.2%. It is in effect projecting a deterioration in the debt level to next year, then stabilisation and then a reduction. Both the IMF and Eurostat forecasts are much worse.
This disparity is a function of two factors. First, the Eurostat and IMF forecasts were made before the reduction in interest rates and before the lower projections for the level of the bank bailout were made. Secondly, the ESRI has stronger real growth projections than either Eurostat or the IMF.
Before dealing with the substantial point of how large the bailout and interest rate savings are, it is worth highlighting the main source of the discrepancy in growth forecasts. In effect, ESRI has a much larger growth forecast of +1.8% real GDP in 2010 than either Eurostat (+0.6%) or the IMF (+0.5%). The difference arises because whereas the IMF and Eurostat both have prices rising by 0.6% in 2010 to reduce real GDP by that degree, the ESRI projects falling prices of 1.1% (implied from the gap between real and nominal GDP (Table 7). Given that deflation both reduces the nominal level of taxation revenues while also increasing the ratio of existing debt to nominal GDP, there can be little argument that this ‘stronger’ growth forecast is responsible for the ESRI’s more optimistic debt/GDP forecasts.
Instead, it is the combination of lower interest rates and a lower projected bank bailout cost which is responsible for the projections of a substantially improved debt outlook. On the former, the consensus appears to be that the annual saving will be in the order of €1bn per annum, perhaps slightly more. Implicitly the ESRI authors assume a saving of €1.125bn per annum, on the basis of a former interest rate of 6% (p.20, point 2.). Compounded, this saving over a 5 year period amounts to €8.5bn or approximately 4.6% of the GDP level projected for 2015.
On the lower bank bailout costs, the international bailout of creditors to Irish banks in November 2010 included €10bn of immediate bank recapitalisation plus another contingency amount of €20bn. To date, of this a total of €17bn has been provided by the State (banks funding €7bn themselves in the financial markets for a total of €24bn). The ESRI authors expect €3bn to be repaid to the State by 2014. This ‘saving’ of €13bn also incurs interest. However, the authors now argue that funding from the Troika will be needed in 2014, even though the terms of the original bailout were that the government would return to the financial markets in 2013. Therefore, there will be no net interest saving, based on the authors’ projections. Instead, there will be an additional cost of approximately €0.5bn (based on the 3.5% interest rate, rather than a projected interest rate of 6% in the financial market borrowings that are also assumed in the ESRI paper). As a result, the projected saving from a less onerous bank bailout is a net €12.5bn.
Taken together the actual interest rate saving of €8.5bn and projected saving on the bank bailout of €12.5bn combine for a total €21bn. This is equivalent to 11.4% of projected 2015 GDP.
Without these actual and projected windfalls, the ESRI forecast would otherwise have been 117.6% of GDP in 2015. This compares to a debt/GDP ratio of 94.9% in 2010.
Debt Dynamics
The idea that there will be no more bank bailouts has firmly taken hold and is largely responsible for the specific rally in Irish government debt in recent weeks. This is despite the fact that the EBA’s stress tests were widely discredited by the failure of two small Spanish banks shortly after publication, with total losses exceeding the EBA’s estimate of EU-wide recapitalisation requirements.
It may be the case that further losses do not require further recapitalisations. But the key exposure of the Irish banks is to the domestic economy, which continues to deteriorate on all forecasts, including those of the ESRI. This has an impact on the banking sector. Currently, this is most evident in the rise in the rate of mortgage defaults.
This highlights a key misconception regarding the relationship between the banking sector, government finances and the real economy. It is assumed that, if the banking sector is stabilised to the extent that it requires no further taxpayer funds, this will restore government finances to health, as long as public spending is reduced towards the level of taxation revenues (sufficient to provide a ‘primary surplus’, that is before interest payments are included). It is argued that, if all three occur, bank stabilisation, no more bailouts, a swing toward a primary surplus, then the crisis ‘will be over in 3 years’.
This is the premise that underlies a section of the ESRI paper dealing with debt dynamics. It is not denied that significant remedial action was required to resolve the crisis in the banking sector, even while many argue that a bailout of all their creditors was one of the least effective means of doing so. But, ever-greater contraction of the domestic economy can only be fatal to any ambitions to remove the banking sector from the life support it has been given by taxpayers. In effect, the ESRI and many others look through the world through the wrong end of the telescope. Neither banks’ balance sheets nor government finances can be restored to health until and unless there is an economic recovery.
The authors argue that, absent any further negative ‘shocks’, the debt/GDP ratio will begin to fall from 2013 onwards. The horizon for an imminent improvement never seems to alter. It is always 18 months hence. But the Irish economy received no external shocks in the way that economists use the term. The recession began here nearly a year before it began in the world economy, the slump in investment also a year earlier (which preceded the recession in both cases).
Three years ago in the Autumn 2008 Quarterly Economic Commentary the ESRI was forecasting a general government debt of 47.5% of GDP in 2009 and was fully supportive of government efforts to cut the deficit, in particular urging cuts in public sector pay. But this contractionary fiscal policy was a shock to the economy and the effect was slower growth, rising unemployment and falling tax revenues.
In the event, the debt/GDP ratio was 65.6% of GDP, not 47.5% in 2009, even while the government implemented ‘austerity’ measures equivalent to 9.1% of GDP. In effect the ESRI was forecasting a near-term deterioration in the debt level followed by stabilisation and then reduction, based on ‘austerity’. In fact a trawl through the QECs since 2008 shows that this debt profile is what the ESRI has been forecasting since 2008.
The authors clearly haven’t asked themselves the key question, so we must: Why will it be different this time?
However, this last contention, that ‘austerity works’, is not supported by the authors’ findings themselves. To quote their own summary of their paper, ‘[Our projected debt ratios are] much lower than had been projected in official figures earlier in the year, partly because the cost of the bank recapitalisation was much lower than anticipated and also because of the reduction in EU interest rates’.
So, the lower projections are based on the lower level of bank recapitalisation and lower rates for bailout funds for those recapitalisations. According to the authors’ abstract of their own findings, none of the projected improvement is attributable to ‘austerity’ measures.
Quality of Forecasts
But how ‘good’ are these forecasts, in both senses? First, what is the quantum of improvement that is being forecast by the ESRI? Secondly, how likely is it that these forecasts will prove correct? The debt ratios forecast by the ESRI are set out in the table below:
Debt Ratios, % GDP

Source: ESRI, Eurostat, IMF databank, Euro Area Spring Forecasts
The first point to note is that the ESRI is not projecting any reduction in the level of government debt over the period 2010 to 2015. Over that period, debt will rise from 94.9% of GDP to a projected 106.2%. It is in effect projecting a deterioration in the debt level to next year, then stabilisation and then a reduction. Both the IMF and Eurostat forecasts are much worse.
This disparity is a function of two factors. First, the Eurostat and IMF forecasts were made before the reduction in interest rates and before the lower projections for the level of the bank bailout were made. Secondly, the ESRI has stronger real growth projections than either Eurostat or the IMF.
Before dealing with the substantial point of how large the bailout and interest rate savings are, it is worth highlighting the main source of the discrepancy in growth forecasts. In effect, ESRI has a much larger growth forecast of +1.8% real GDP in 2010 than either Eurostat (+0.6%) or the IMF (+0.5%). The difference arises because whereas the IMF and Eurostat both have prices rising by 0.6% in 2010 to reduce real GDP by that degree, the ESRI projects falling prices of 1.1% (implied from the gap between real and nominal GDP (Table 7). Given that deflation both reduces the nominal level of taxation revenues while also increasing the ratio of existing debt to nominal GDP, there can be little argument that this ‘stronger’ growth forecast is responsible for the ESRI’s more optimistic debt/GDP forecasts.
Instead, it is the combination of lower interest rates and a lower projected bank bailout cost which is responsible for the projections of a substantially improved debt outlook. On the former, the consensus appears to be that the annual saving will be in the order of €1bn per annum, perhaps slightly more. Implicitly the ESRI authors assume a saving of €1.125bn per annum, on the basis of a former interest rate of 6% (p.20, point 2.). Compounded, this saving over a 5 year period amounts to €8.5bn or approximately 4.6% of the GDP level projected for 2015.
On the lower bank bailout costs, the international bailout of creditors to Irish banks in November 2010 included €10bn of immediate bank recapitalisation plus another contingency amount of €20bn. To date, of this a total of €17bn has been provided by the State (banks funding €7bn themselves in the financial markets for a total of €24bn). The ESRI authors expect €3bn to be repaid to the State by 2014. This ‘saving’ of €13bn also incurs interest. However, the authors now argue that funding from the Troika will be needed in 2014, even though the terms of the original bailout were that the government would return to the financial markets in 2013. Therefore, there will be no net interest saving, based on the authors’ projections. Instead, there will be an additional cost of approximately €0.5bn (based on the 3.5% interest rate, rather than a projected interest rate of 6% in the financial market borrowings that are also assumed in the ESRI paper). As a result, the projected saving from a less onerous bank bailout is a net €12.5bn.
Taken together the actual interest rate saving of €8.5bn and projected saving on the bank bailout of €12.5bn combine for a total €21bn. This is equivalent to 11.4% of projected 2015 GDP.
Without these actual and projected windfalls, the ESRI forecast would otherwise have been 117.6% of GDP in 2015. This compares to a debt/GDP ratio of 94.9% in 2010.
Debt Dynamics
The idea that there will be no more bank bailouts has firmly taken hold and is largely responsible for the specific rally in Irish government debt in recent weeks. This is despite the fact that the EBA’s stress tests were widely discredited by the failure of two small Spanish banks shortly after publication, with total losses exceeding the EBA’s estimate of EU-wide recapitalisation requirements.
It may be the case that further losses do not require further recapitalisations. But the key exposure of the Irish banks is to the domestic economy, which continues to deteriorate on all forecasts, including those of the ESRI. This has an impact on the banking sector. Currently, this is most evident in the rise in the rate of mortgage defaults.
This highlights a key misconception regarding the relationship between the banking sector, government finances and the real economy. It is assumed that, if the banking sector is stabilised to the extent that it requires no further taxpayer funds, this will restore government finances to health, as long as public spending is reduced towards the level of taxation revenues (sufficient to provide a ‘primary surplus’, that is before interest payments are included). It is argued that, if all three occur, bank stabilisation, no more bailouts, a swing toward a primary surplus, then the crisis ‘will be over in 3 years’.
This is the premise that underlies a section of the ESRI paper dealing with debt dynamics. It is not denied that significant remedial action was required to resolve the crisis in the banking sector, even while many argue that a bailout of all their creditors was one of the least effective means of doing so. But, ever-greater contraction of the domestic economy can only be fatal to any ambitions to remove the banking sector from the life support it has been given by taxpayers. In effect, the ESRI and many others look through the world through the wrong end of the telescope. Neither banks’ balance sheets nor government finances can be restored to health until and unless there is an economic recovery.
The authors argue that, absent any further negative ‘shocks’, the debt/GDP ratio will begin to fall from 2013 onwards. The horizon for an imminent improvement never seems to alter. It is always 18 months hence. But the Irish economy received no external shocks in the way that economists use the term. The recession began here nearly a year before it began in the world economy, the slump in investment also a year earlier (which preceded the recession in both cases).
Three years ago in the Autumn 2008 Quarterly Economic Commentary the ESRI was forecasting a general government debt of 47.5% of GDP in 2009 and was fully supportive of government efforts to cut the deficit, in particular urging cuts in public sector pay. But this contractionary fiscal policy was a shock to the economy and the effect was slower growth, rising unemployment and falling tax revenues.
In the event, the debt/GDP ratio was 65.6% of GDP, not 47.5% in 2009, even while the government implemented ‘austerity’ measures equivalent to 9.1% of GDP. In effect the ESRI was forecasting a near-term deterioration in the debt level followed by stabilisation and then reduction, based on ‘austerity’. In fact a trawl through the QECs since 2008 shows that this debt profile is what the ESRI has been forecasting since 2008.
The authors clearly haven’t asked themselves the key question, so we must: Why will it be different this time?
Friday, 2 September 2011
Mental well-being and inequality
Tom McDonnell: Richard Layte of the ESRI reports some interesting results on the association between income inequality and mental well-being here.
He finds that more unequal societies are characterised by lower levels of social trust and by greater feelings of inferiority at the bottom of the income scale. He forwards the argument that his empirical findings suggest these factors explain the lower levels of mental well-being in more unequal countries which contribute to higher levels of mental illness. High levels of inequality also stack the odds against poorer children succeeding.
The pro-inequality arguments were perhaps most memorably articulated by Michael McDowell.
While some of the privileged six-figure-salary brigade are conveniently quick to justify high inequality on economic growth and ‘incentive’ grounds, the actual empirical evidence does not appear to corroborate their arguments. As Layte points out, the more equal societies in Europe are also on average richer.
He finds that more unequal societies are characterised by lower levels of social trust and by greater feelings of inferiority at the bottom of the income scale. He forwards the argument that his empirical findings suggest these factors explain the lower levels of mental well-being in more unequal countries which contribute to higher levels of mental illness. High levels of inequality also stack the odds against poorer children succeeding.
The pro-inequality arguments were perhaps most memorably articulated by Michael McDowell.
While some of the privileged six-figure-salary brigade are conveniently quick to justify high inequality on economic growth and ‘incentive’ grounds, the actual empirical evidence does not appear to corroborate their arguments. As Layte points out, the more equal societies in Europe are also on average richer.
Thursday, 20 January 2011
Recovery? What recovery?
Michael Taft: The ESRI’s new quarterly analysis is out (though not available on-line for 30 days). Though its forecasts are more pessimistic than the Government’s projections, they state:
‘ . . . we would not place too great an emphasis on the difference. Instead, we take it as being an on-going indicator of the challenges which are faced in restoring the public finances to a sustainable path.’
Maybe so, but the challenges, then, are getting even challengier. Let’s summarise.
Economic Growth
The ESRI is projecting sluggish growth coming off the recession. Whereas the Government is hoping for 4.9 percent GDP growth over the next two years, the ESRI suggests it will be only 3.7 percent.
The gap between the two is even larger with GNP – 3.6 percent compared to 1.7 percent. The domestic economy, according to the ESRI, will grow by less than half the rate the Government projects.
That considerable gap is more understandable when we see that the ESRI projects that the economy will still be in a domestic-demand recession by 2012 – the fifth year running.
Employment
The Government is hoping that net job creation over the two years will be positive – 21,000. The ESRI, reflecting their pessimism on the domestic economy, sees employment falling – by 20,000. Industry will continue to slide despite the increase in merchandise exports, falling by over 4 percent, with the service sector registering a smaller percentage fall.
Emigration, which is rightfully getting big headlines, is projected to be 100,000 over the next two years. The Government projected emigration to be 100,000 as well – but over the four year period up to 2014. Even with this higher emigration, the ESRI projects that the unemployment rate will still be higher than the Government’s estimates by 2012: 13 percent compared to 12 percent.
Investment
The fall in investment has been the driver in the Irish recession. According to the ESRI it will be some time before it is a driver in the recovery (at least under current policy). Investment is expected to fall, in nominal terms, from €18 billion to €17.6 billion by 2012.
Let’s put that in some perspective. In 2007, capital formation stood at €46 billion. Of course, much of this was part of the boom which was always going to melt away. But the Government hasn’t helped – cutting public investment by half since 2008, from €9 billion to €4.7 billion this year (and €3.5 billion by 2014). The even greater reliance on private sector investment will mean minimal growth over the years ahead.
Exports
This is the one category going from strength to strength. The ESRI is even more optimistic than the Government, projecting exports to grow by 11 percent over the next two years, after a strong performance last year (estimated at over 8 percent). But while the ESRI predicts growth in all sectors (goods, services, tourism), they are most bullish on what is essentially the modern sectors which are dominated by multi-nationals. As pointed out here, growth in the multi-national sectors will have a far less impact on the domestic economy than growth in indigenous exports. So the headline rate looks positive, but we will need more details on the composition of exports (which the ESRI doesn’t have) to assess its final impact on economic growth.
Consumer Spending
Another category of negative growth. The Government is hoping that consumer spending will grow, though only marginally (0.9 percent over the next two years); the ESRI is projecting a further fall of – 1.5 percent. This is due to income tax increases, cuts in social transfers, falling employment and emigration, etc. We can also throw in rising interest rates – the ESRI projects that the ECB main rate will rise from 1.0 to 2.5 by 2012. Higher payments on mortgages and other debt, means less spending on goods and services. All in all, consumer sentiment is expected to be cautious with the savings ratio remaining high.
Public Finances
Domestic demand, investment, consumer spending, employment – all down from Government projections. Yet, the ESRI is still hopeful that Government deficit targets can be met. In 2012, they are projecting a deficit of -7.7 percent, only fractionally worse than the Government’s own -7.4 percent projection. They explain it this way.
On the revenue side, the ESRI estimates that tax revenue will be €1.6 billion lower than Government estimates by 2012 – reflecting low economic and employment growth.
On the expenditure side, the ESRI estimates that net current spending will be €900 million less. This is made up mostly of declining interest payments (€800 million) arising from the reduction of the Exchequer cash balances as part of the IMF/EU bail-out.
If interest payments fall at the rate ESRI projects, the Government might hope to reach their target. But with revenue slipping and more demand on expenditure arising from higher unemployment and low incomes, the ESRI may be too optimistic on this score.
‘ . . . we would not place too great an emphasis on the difference. Instead, we take it as being an on-going indicator of the challenges which are faced in restoring the public finances to a sustainable path.’
Maybe so, but the challenges, then, are getting even challengier. Let’s summarise.
Economic Growth
The ESRI is projecting sluggish growth coming off the recession. Whereas the Government is hoping for 4.9 percent GDP growth over the next two years, the ESRI suggests it will be only 3.7 percent.
The gap between the two is even larger with GNP – 3.6 percent compared to 1.7 percent. The domestic economy, according to the ESRI, will grow by less than half the rate the Government projects.
That considerable gap is more understandable when we see that the ESRI projects that the economy will still be in a domestic-demand recession by 2012 – the fifth year running.
Employment
The Government is hoping that net job creation over the two years will be positive – 21,000. The ESRI, reflecting their pessimism on the domestic economy, sees employment falling – by 20,000. Industry will continue to slide despite the increase in merchandise exports, falling by over 4 percent, with the service sector registering a smaller percentage fall.
Emigration, which is rightfully getting big headlines, is projected to be 100,000 over the next two years. The Government projected emigration to be 100,000 as well – but over the four year period up to 2014. Even with this higher emigration, the ESRI projects that the unemployment rate will still be higher than the Government’s estimates by 2012: 13 percent compared to 12 percent.
Investment
The fall in investment has been the driver in the Irish recession. According to the ESRI it will be some time before it is a driver in the recovery (at least under current policy). Investment is expected to fall, in nominal terms, from €18 billion to €17.6 billion by 2012.
Let’s put that in some perspective. In 2007, capital formation stood at €46 billion. Of course, much of this was part of the boom which was always going to melt away. But the Government hasn’t helped – cutting public investment by half since 2008, from €9 billion to €4.7 billion this year (and €3.5 billion by 2014). The even greater reliance on private sector investment will mean minimal growth over the years ahead.
Exports
This is the one category going from strength to strength. The ESRI is even more optimistic than the Government, projecting exports to grow by 11 percent over the next two years, after a strong performance last year (estimated at over 8 percent). But while the ESRI predicts growth in all sectors (goods, services, tourism), they are most bullish on what is essentially the modern sectors which are dominated by multi-nationals. As pointed out here, growth in the multi-national sectors will have a far less impact on the domestic economy than growth in indigenous exports. So the headline rate looks positive, but we will need more details on the composition of exports (which the ESRI doesn’t have) to assess its final impact on economic growth.
Consumer Spending
Another category of negative growth. The Government is hoping that consumer spending will grow, though only marginally (0.9 percent over the next two years); the ESRI is projecting a further fall of – 1.5 percent. This is due to income tax increases, cuts in social transfers, falling employment and emigration, etc. We can also throw in rising interest rates – the ESRI projects that the ECB main rate will rise from 1.0 to 2.5 by 2012. Higher payments on mortgages and other debt, means less spending on goods and services. All in all, consumer sentiment is expected to be cautious with the savings ratio remaining high.
Public Finances
Domestic demand, investment, consumer spending, employment – all down from Government projections. Yet, the ESRI is still hopeful that Government deficit targets can be met. In 2012, they are projecting a deficit of -7.7 percent, only fractionally worse than the Government’s own -7.4 percent projection. They explain it this way.
On the revenue side, the ESRI estimates that tax revenue will be €1.6 billion lower than Government estimates by 2012 – reflecting low economic and employment growth.
On the expenditure side, the ESRI estimates that net current spending will be €900 million less. This is made up mostly of declining interest payments (€800 million) arising from the reduction of the Exchequer cash balances as part of the IMF/EU bail-out.
If interest payments fall at the rate ESRI projects, the Government might hope to reach their target. But with revenue slipping and more demand on expenditure arising from higher unemployment and low incomes, the ESRI may be too optimistic on this score.
Thursday, 29 July 2010
The unacknowledged demise of the Government's fiscal strategy
Michael Taft: Strange how some things don’t get into the debate. For instance, the ESRI’s recent Recovery Scenarios judged the Government’s fiscal strategy a failure. It estimated that not only will the Government fail to bring public finances under control by 2014 (if we take the Maastricht guideline as the ‘control’ threshold), it will not be able to do so by 2020. Did any of this get into the debate? Were there discussions on the failure of spending cuts? No. The debate is impervious to such awkward interventions. Spending cuts are good. No amount of reality will be allowed to perturb the consensus.
The ESRI presented two growth scenarios for the Irish economy – high-growth and low-growth. In reality, the low-growth scenario is more likely for the simple reason that it is not really ‘low’. It’s lower than the Government’s projections (which have been labelled ‘optimistic’ by the IMF and the OECD) but higher than the IMF estimates. So it’s pretty much in the mid-range.
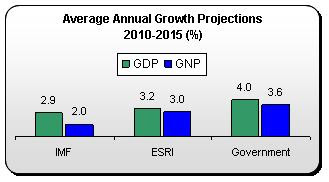
On the basis of this low-growth scenario, the ESRI says the Government cannot reach the Maastricht threshold – not by 2014, not by 2015 not even by 2020.
• By 2015 the deficit is estimated to be 4.1 percent (not counting any banking subsidies)
• By 2020 the deficit is estimated to be 4.5 percent
In addition, they estimate our overall debt levels will be 102 percent of GDP in 2015, rising to 106 percent five years later.
The reason the deficit and debt start rising after 2015 is because the ESRI estimates that real growth will start to ease off, falling from an average 3.2 percent over the next five years, to 2.1 percent afterwards. On this basis, we would have to cut the deficit to well below -3 percent by 2015, just to ensure we don’t rise above it again in a few years. They summarise the problem:
‘The lower level of economic activity would reduce government revenue from taxation while the higher unemployment rate and borrowing would increase government expenditure on welfare payments and interest payments. This would result in a significant deterioration in the general government balance . . ‘
So why, according to the ESRI, would this state of affairs come about? They first assume the economy won’t respond to increased world growth as robustly as in the past. But they also point out that a poorly functioning banking system, higher cost of capital and structural unemployment could also contribute to a low-growth scenario.
What they don’t mention is the impact of the Government’s deflationary cuts - which is strange since they point out that the Government’s €3 billion fiscal contraction in the 2011 budget will cut economic growth (by approximately 1 percent – though this was before the Government’s announcement that spending cuts, which are more deflationary, will play a more prominent role in the composition of the contraction).
It is even stranger since they have just released a revised set of fiscal multipliers, updating their paper from last year. These updated multipliers show that they previously under-estimated the impact of spending cuts on economic growth:
• A €1 billion cut in public sector wages will reduce GNP by 0.4 percent (previously it was 0.3 percent)
• A €1 billion cut in public sector employment (about 17,000 jobs) will reduce GNP growth by 1.0 percent (previously t was 0.9 percent)
These might seem marginal but given the scale of cutbacks the Government (€2.4 billion in pay cuts, €3.6 billion in non-wage consumption, €2.6 billion in investment cuts), it all adds up.
The key metric is employment and this, more than anything else, helps explain the low levels of growth and, so, the failure of the Government’s fiscal policy. The ESRI estimates that employment will grow by an average 1.3 percent between 2010 and 2015. This compares to the Government’s estimate of 2.0 percent average.
Again, this might not seem much but add it up. But by 2015, the ESRI is estimating we will have approximately 70,000 fewer jobs than the Government’s projections. When you factor in the impact on tax revenue, unemployment costs and the significant social costs of long-term and structural unemployment – you start to see why the Government’s fiscal strategy will fail.
None of this should come as any news – if we were fortunate to get the news: the IMF similarly projected the Government’s fiscal strategy will fail. So, too, did the Ernst & Young / Oxford Economics report (though they held out hope that the deficit might come under control by 2018/2019 – but only at growth rates that exceed the ESRI’s estimates).
Of course, some might be tempted to say, that after nearly €9 billion of spending cuts with the prospect of billions more planned, all we need to do is cut just that little bit more. Just dig a little deeper and we’ll get out of the hole. But that’s the problem – every new estimate, every new projection tells us that fiscal consolidation is getting further and further away the more we cut. How much longer do we go along with this ‘Boxer mentality’ in the face of an emerging consensus that the Government’s strategy is flawed at its core; that no amount of tweaking will rescue it. Indeed, further cuts, in addition to what the Government is planning, will only undermine economic and employment growth even more. What will we do then? Call for even more cuts? How deep does the hole have to get before we stop digging?
So what have got? Low growth, escalating debt, high unemployment and emigration, sluggish economy – and the failure to repair public finances; if the ESRI buried the Government’s fiscal consolidation strategy, it also buried the McCarthy report. You probably didn’t hear about that either.
That’s why my next post will deal with that.
The ESRI presented two growth scenarios for the Irish economy – high-growth and low-growth. In reality, the low-growth scenario is more likely for the simple reason that it is not really ‘low’. It’s lower than the Government’s projections (which have been labelled ‘optimistic’ by the IMF and the OECD) but higher than the IMF estimates. So it’s pretty much in the mid-range.

On the basis of this low-growth scenario, the ESRI says the Government cannot reach the Maastricht threshold – not by 2014, not by 2015 not even by 2020.
• By 2015 the deficit is estimated to be 4.1 percent (not counting any banking subsidies)
• By 2020 the deficit is estimated to be 4.5 percent
In addition, they estimate our overall debt levels will be 102 percent of GDP in 2015, rising to 106 percent five years later.
The reason the deficit and debt start rising after 2015 is because the ESRI estimates that real growth will start to ease off, falling from an average 3.2 percent over the next five years, to 2.1 percent afterwards. On this basis, we would have to cut the deficit to well below -3 percent by 2015, just to ensure we don’t rise above it again in a few years. They summarise the problem:
‘The lower level of economic activity would reduce government revenue from taxation while the higher unemployment rate and borrowing would increase government expenditure on welfare payments and interest payments. This would result in a significant deterioration in the general government balance . . ‘
So why, according to the ESRI, would this state of affairs come about? They first assume the economy won’t respond to increased world growth as robustly as in the past. But they also point out that a poorly functioning banking system, higher cost of capital and structural unemployment could also contribute to a low-growth scenario.
What they don’t mention is the impact of the Government’s deflationary cuts - which is strange since they point out that the Government’s €3 billion fiscal contraction in the 2011 budget will cut economic growth (by approximately 1 percent – though this was before the Government’s announcement that spending cuts, which are more deflationary, will play a more prominent role in the composition of the contraction).
It is even stranger since they have just released a revised set of fiscal multipliers, updating their paper from last year. These updated multipliers show that they previously under-estimated the impact of spending cuts on economic growth:
• A €1 billion cut in public sector wages will reduce GNP by 0.4 percent (previously it was 0.3 percent)
• A €1 billion cut in public sector employment (about 17,000 jobs) will reduce GNP growth by 1.0 percent (previously t was 0.9 percent)
These might seem marginal but given the scale of cutbacks the Government (€2.4 billion in pay cuts, €3.6 billion in non-wage consumption, €2.6 billion in investment cuts), it all adds up.
The key metric is employment and this, more than anything else, helps explain the low levels of growth and, so, the failure of the Government’s fiscal policy. The ESRI estimates that employment will grow by an average 1.3 percent between 2010 and 2015. This compares to the Government’s estimate of 2.0 percent average.
Again, this might not seem much but add it up. But by 2015, the ESRI is estimating we will have approximately 70,000 fewer jobs than the Government’s projections. When you factor in the impact on tax revenue, unemployment costs and the significant social costs of long-term and structural unemployment – you start to see why the Government’s fiscal strategy will fail.
None of this should come as any news – if we were fortunate to get the news: the IMF similarly projected the Government’s fiscal strategy will fail. So, too, did the Ernst & Young / Oxford Economics report (though they held out hope that the deficit might come under control by 2018/2019 – but only at growth rates that exceed the ESRI’s estimates).
Of course, some might be tempted to say, that after nearly €9 billion of spending cuts with the prospect of billions more planned, all we need to do is cut just that little bit more. Just dig a little deeper and we’ll get out of the hole. But that’s the problem – every new estimate, every new projection tells us that fiscal consolidation is getting further and further away the more we cut. How much longer do we go along with this ‘Boxer mentality’ in the face of an emerging consensus that the Government’s strategy is flawed at its core; that no amount of tweaking will rescue it. Indeed, further cuts, in addition to what the Government is planning, will only undermine economic and employment growth even more. What will we do then? Call for even more cuts? How deep does the hole have to get before we stop digging?
So what have got? Low growth, escalating debt, high unemployment and emigration, sluggish economy – and the failure to repair public finances; if the ESRI buried the Government’s fiscal consolidation strategy, it also buried the McCarthy report. You probably didn’t hear about that either.
That’s why my next post will deal with that.
Wednesday, 21 July 2010
Leprechauns and Confidence Fairies
Writing in the New York Times, Paul Krugman is unimpressed by the latest ESRI report.
He writes: "The authors simply assert that more austerity now would lead to a lower risk premium and hence higher growth, based on no evidence I can see. They don’t even offer any quantitative assessment of the extent to which more austerity while the economy is still depressed would reduce future debt burdens."
He writes: "The authors simply assert that more austerity now would lead to a lower risk premium and hence higher growth, based on no evidence I can see. They don’t even offer any quantitative assessment of the extent to which more austerity while the economy is still depressed would reduce future debt burdens."
Wednesday, 14 July 2010
One step forward, one step backward, one step sideways
Michael Taft: The ESRI’s Summer Quarterly Economic Quarterly is full of data for just about every perspective on the economy – from the optimist to the pessimistic and all attitudes in between:
While data on retail sales, consumer confidence and exports all point to signs that a recovery is already underway, the numbers from the Live Register, income tax returns and the most recent estimates of quarterly GNP would suggest that the economy is still contracting.
Here’s the statistic that screams out to me: the ESRI has revised downwards their GNP growth projections (i.e. the domestic economy) for both this year and next year. Three months ago, the ESRI projected GNP growth this year to be 0 percent; now they’re saying it will decline by -0.5 percent; three months ago they projected GNP to grow in 2011 by 2.7 percent; now it’s 2.2 percent.

This is what other forecasters have been doing – revising downwards our domestic economy even as our export-driven GDP is growing. Three months ago, the ESRI was estimating that GNP growth would outstrip GDP growth over the next two years: 2.7 compared 2 percent.
Now the situation is completely reversed. While they have revised upwards GDP growth upwards by half over this year and next, they have cut GNP growth by nearly half. From outstripping GDP growth, the domestic economy is now lagging considerably.
But even these downward revisions may prove to be optimistic:
‘ . . . the short-term prospects for the Irish economy continue to be precarious . . . the forecasts . . . are critically based on the assumption that difficulties in international financial markets will be resolved swiftly.’
Those are heavy dice to roll – banking on a swift resolution.
While the ESRI report will produce a considerable debate over the next few days, let’s canvas a few issues here:
Employment: No good news here. If anything, the ESRI are marginally more pessimistic revising downwards employment levels in 2011. In short, there will be no jobs growth next year – compared to the Government’s target of 20,000 new jobs. This will result in an unemployment rate of 13 percent next year; again, slightly up on Government projections. Thanks goodness for all that emigration – which is now estimated to rise to 120,000 over this year and next. If it weren’t for emigration, the unemployment rate would be close to 17 percent.
Deficit: a lot of the attention will be paid to the ESRI’s decision to include the bank bail-out money in the annual deficit. In truth, given the EU’s ruling on the Anglo-Irish bail-out, they had no choice. As a result, the deficit will balloon this year to nearly -20 percent. The Government will, with some justification, point to the underlying deficit; that is, the deficit minus the bail-out money.
On this reading, the deficit is projected to come it at -11.6 percent, which is consistent with Government forecasts. However, there is one difference. The ESRI is anticipating a considerable increase in tax revenue compared to what the Government estimates. The tax revenue projections for 2010 are:
• Government: €31.1 billion
• ESRI: €32.6 billion
The ESRI is expecting tax revenue to exceed Government estimates by over 4 percent. The problem is that the half-yearly Exchequer returns show tax revenue to be -1.6 percent below Government targets. The ESRI is hoping for a big turnaround in the second half of this year, through marginally higher consumer spending and GDP growth. However, with job numbers and aggregate wages in decline, with the revision downwards in GNP growth, this remains to be seen.
If tax revenue figures end up closer to the Government’s estimates, then the deficit will easily exceed -12 percent. This is not what was supposed to happen.
Investment: The ESRI makes a curious and unexplained assertion.
‘We argue that public funds would be better used in re-skilling and up-skilling people who are unemployed as opposed to using spending on infrastructure as a form of employment creation. It appears to us that public funds would be better used in re-skilling and up-skilling people . . . As argued by Morgenroth, public capital projects should be undertaken on the basis that they have a long-run return to the whole economy and not because they create short-term employment. This is because of a relatively high cost per job created via public investment.’
This is an incredible statement by any measurement. ‘We argue’: no, they don’t. They assert because ‘it appears’. The ESRI puts investment and retraining in opposition when, in fact, they are complementary. Morgenroth’s argument cannot be taken as an argument against investment; in fact, it is a cogent argument for well-thought out initiatives that will deliver increased productivity, higher economic activity and, as it happens, more jobs.
Take IBEC’s proposal for a Next Generation broadband network capable of 90 percent coverage in the country: does anyone doubt the long-term boost to the economy. This would have enormous supply-side benefits which will continue to contribute to growth, employment and higher incomes in the long-term. And in the short-term, it would increase employment and growth as well – IBEC estimates that two-thirds of the €2.2 billion cost of this project would be spent on civil engineering works. Good for the short-term, good for the long-term. This is an investment stimulus strategy that focuses on those projects we would need to complete in any event, regardless of the recession.
The ESRI’s ‘argument’ against infrastructural investment amounts to a 76 word assertion. No data, no model, no facts. I could say this is not good enough; but, in truth, this is the way the debate has been conducted.
* * *
The ESRI report points to a two-tier economy a modern, multi-national sector which is neither tax-rich, because we don’t tax them, nor job-rich since it is capital intensive; a low-growth, high debt (debt is hurtling towards a worrying 100 percent of GDP), high unemployment medium-term.
Some will call this a recovery. There are better words.
While data on retail sales, consumer confidence and exports all point to signs that a recovery is already underway, the numbers from the Live Register, income tax returns and the most recent estimates of quarterly GNP would suggest that the economy is still contracting.
Here’s the statistic that screams out to me: the ESRI has revised downwards their GNP growth projections (i.e. the domestic economy) for both this year and next year. Three months ago, the ESRI projected GNP growth this year to be 0 percent; now they’re saying it will decline by -0.5 percent; three months ago they projected GNP to grow in 2011 by 2.7 percent; now it’s 2.2 percent.

This is what other forecasters have been doing – revising downwards our domestic economy even as our export-driven GDP is growing. Three months ago, the ESRI was estimating that GNP growth would outstrip GDP growth over the next two years: 2.7 compared 2 percent.
Now the situation is completely reversed. While they have revised upwards GDP growth upwards by half over this year and next, they have cut GNP growth by nearly half. From outstripping GDP growth, the domestic economy is now lagging considerably.
But even these downward revisions may prove to be optimistic:
‘ . . . the short-term prospects for the Irish economy continue to be precarious . . . the forecasts . . . are critically based on the assumption that difficulties in international financial markets will be resolved swiftly.’
Those are heavy dice to roll – banking on a swift resolution.
While the ESRI report will produce a considerable debate over the next few days, let’s canvas a few issues here:
Employment: No good news here. If anything, the ESRI are marginally more pessimistic revising downwards employment levels in 2011. In short, there will be no jobs growth next year – compared to the Government’s target of 20,000 new jobs. This will result in an unemployment rate of 13 percent next year; again, slightly up on Government projections. Thanks goodness for all that emigration – which is now estimated to rise to 120,000 over this year and next. If it weren’t for emigration, the unemployment rate would be close to 17 percent.
Deficit: a lot of the attention will be paid to the ESRI’s decision to include the bank bail-out money in the annual deficit. In truth, given the EU’s ruling on the Anglo-Irish bail-out, they had no choice. As a result, the deficit will balloon this year to nearly -20 percent. The Government will, with some justification, point to the underlying deficit; that is, the deficit minus the bail-out money.
On this reading, the deficit is projected to come it at -11.6 percent, which is consistent with Government forecasts. However, there is one difference. The ESRI is anticipating a considerable increase in tax revenue compared to what the Government estimates. The tax revenue projections for 2010 are:
• Government: €31.1 billion
• ESRI: €32.6 billion
The ESRI is expecting tax revenue to exceed Government estimates by over 4 percent. The problem is that the half-yearly Exchequer returns show tax revenue to be -1.6 percent below Government targets. The ESRI is hoping for a big turnaround in the second half of this year, through marginally higher consumer spending and GDP growth. However, with job numbers and aggregate wages in decline, with the revision downwards in GNP growth, this remains to be seen.
If tax revenue figures end up closer to the Government’s estimates, then the deficit will easily exceed -12 percent. This is not what was supposed to happen.
Investment: The ESRI makes a curious and unexplained assertion.
‘We argue that public funds would be better used in re-skilling and up-skilling people who are unemployed as opposed to using spending on infrastructure as a form of employment creation. It appears to us that public funds would be better used in re-skilling and up-skilling people . . . As argued by Morgenroth, public capital projects should be undertaken on the basis that they have a long-run return to the whole economy and not because they create short-term employment. This is because of a relatively high cost per job created via public investment.’
This is an incredible statement by any measurement. ‘We argue’: no, they don’t. They assert because ‘it appears’. The ESRI puts investment and retraining in opposition when, in fact, they are complementary. Morgenroth’s argument cannot be taken as an argument against investment; in fact, it is a cogent argument for well-thought out initiatives that will deliver increased productivity, higher economic activity and, as it happens, more jobs.
Take IBEC’s proposal for a Next Generation broadband network capable of 90 percent coverage in the country: does anyone doubt the long-term boost to the economy. This would have enormous supply-side benefits which will continue to contribute to growth, employment and higher incomes in the long-term. And in the short-term, it would increase employment and growth as well – IBEC estimates that two-thirds of the €2.2 billion cost of this project would be spent on civil engineering works. Good for the short-term, good for the long-term. This is an investment stimulus strategy that focuses on those projects we would need to complete in any event, regardless of the recession.
The ESRI’s ‘argument’ against infrastructural investment amounts to a 76 word assertion. No data, no model, no facts. I could say this is not good enough; but, in truth, this is the way the debate has been conducted.
* * *
The ESRI report points to a two-tier economy a modern, multi-national sector which is neither tax-rich, because we don’t tax them, nor job-rich since it is capital intensive; a low-growth, high debt (debt is hurtling towards a worrying 100 percent of GDP), high unemployment medium-term.
Some will call this a recovery. There are better words.
The future looks like the past
Michael Burke: The latest ESRI Quartely Report is just published. Coincidentally, it follows hard on the heels of a piece by Paul Krugman in the New York Times arguing that, with inflation below the Fed's target and policymakers passive, there is a danger of debt/deflation.
In this economy, there is no criticism that policymakers have been passive. They have been hyper-active in withdrawing demand from the economy during a recession, four budget packages and more threatened, just as they were responsible for stoking demand in the midst of a boom. As a result, now there isn't a danger of deflation - there is the reality.
In the ESRI Report, the data and forecasts provide a sharp warning about the dangers of debt/deflation. According to the ESRI analysts, the GDP price deflator fell by 4% in 2009 (p.8, Table A) and is forecast to fall by 0.75% again in 2010 (p.9 Table A). But the problems go deeper than that.
The export sector is largely untaxed, and in any event provides few jobs. We therefore have to look to GNP for both. But GNP is expected to decline once more, despite the much-vaunted recovery by 0.6% (p.10 Table A), leading to a further cntraction in employment in both this year and next. Worse, because of continuing deflation, the value of GNP is forecast to fall by 2.6%.
Why does this matter? The importance of these deflationary trends concentrated in the domestic economy is clear if we consider the amount of ¤ produced. In 2008 the monetary value of GNP was €154.7bn but by the end of this year it will under ESRI forecasts have contracted to €128.7bn. In 2007 it was €162.9bn. That is a cumulative fall of 21%. A Depression.
Debt/Deflation
This highlights the risk of debt/deflation: anyone, individual, business or government, that borrowed an existing debt in 2007 or before still has to service the same debt and at some point repay it. Only, on average, the current incomes to service that, and the income to repay it, have fallen by 21%. The debt burden is getting much heavier.
The entirety of government policy is said to be focused on cutting its own deficit. But because of the policy-induced Depression, it is actually rising. In terms of the General Governemtn Balance (the Maastricht definition of the deficit) the ESRI forecasts that the deficit will widen to €31.3bn this year, or 19.75% of GDP. That's up from €13.2bn as recently as 2008, and a small surplus in 2007.
The ESRI does say it expects the deficit to fall in 2011. There is an assumption that there will be no further bank bailouts, so the the 'underlying deficit' will decline from 11.5% of GDP to 10.5%. However, this last forecast is premised on the idea that a 'full package of €3bn in austerity measures' is implemented in full.
But we have been here before with the ESRI. They assumed as much in the Spring 2009 Report, argung for the full implementation of €4bn spending cuts and tax increases, plus €750mn in capital spending cuts. And what was the verdict? If we take only the Exchequer budget balance, leaving aside all the bailouts, the ESRI assumed then that the deficits would be €25.7bn and €19.3bn in 2009 and 2010 respectively. The oututurn and forecast for those two years is now estmated and forecast by the ESRI to be ¤24.6bn and ¤17.6bn respectively. That is a 'saving' of €1.1bn and €1.7bn, versus total Budget measures equivalent to €17.6bn once this year's measures are included (which ESRI does). It only 'works' at all because of resumed mass emigration lightening the welfare bill, at a cost of the long-term capacity of the economy and an increased dependency age of its poplation.
And the stock of debt keeps rising as the deficit remains stubbornly high, interestpayments mount and the GDP denominator declines, from 25.1% in 2007 to a forecast of 93.5% in 2011.
Investment
The main problem in the economy remains the slump in investment. Gross fixed capital formation has fallen by €31.7bn from its peak. This accounts for more than either the decline in GDP or GNP during the recession. It is down for 12 consecutive quarters, falling again in Q1, down 30% from Q1 2009. The ESRI is forecasting that it will fall by a further 24% in 2010 (p.10, Table A). This would leave investment at just 12.5% of GDP. By comparison, even with the slump in investment elsewhere, the OECD average investment rate in Q4 2009 was 18.4% of GDP, and is expected to pick up somewhat later in the course of this year. At this rate, the genuine MNCs based here might have to reconsider their position.
If the ruling ideology bore any relation to reality, this could not be happening. 'Expansonary Fiscal Contractions', 'crowding in' and similar nonsense are premised on the idea that, as government withdraws from economic activity, the private sector would fill the gap, and more efficiently. It is doing neither. It is further argued that cutting government spending, both current spending and capital spending will reduce the deficit and the debt. But the decline in the deficit still remains next year's forecast away and the debt continues to climb. Meanwhile hundreds of thousands of Irish women and men are not working.
Neither is policy.
In this economy, there is no criticism that policymakers have been passive. They have been hyper-active in withdrawing demand from the economy during a recession, four budget packages and more threatened, just as they were responsible for stoking demand in the midst of a boom. As a result, now there isn't a danger of deflation - there is the reality.
In the ESRI Report, the data and forecasts provide a sharp warning about the dangers of debt/deflation. According to the ESRI analysts, the GDP price deflator fell by 4% in 2009 (p.8, Table A) and is forecast to fall by 0.75% again in 2010 (p.9 Table A). But the problems go deeper than that.
The export sector is largely untaxed, and in any event provides few jobs. We therefore have to look to GNP for both. But GNP is expected to decline once more, despite the much-vaunted recovery by 0.6% (p.10 Table A), leading to a further cntraction in employment in both this year and next. Worse, because of continuing deflation, the value of GNP is forecast to fall by 2.6%.
Why does this matter? The importance of these deflationary trends concentrated in the domestic economy is clear if we consider the amount of ¤ produced. In 2008 the monetary value of GNP was €154.7bn but by the end of this year it will under ESRI forecasts have contracted to €128.7bn. In 2007 it was €162.9bn. That is a cumulative fall of 21%. A Depression.
Debt/Deflation
This highlights the risk of debt/deflation: anyone, individual, business or government, that borrowed an existing debt in 2007 or before still has to service the same debt and at some point repay it. Only, on average, the current incomes to service that, and the income to repay it, have fallen by 21%. The debt burden is getting much heavier.
The entirety of government policy is said to be focused on cutting its own deficit. But because of the policy-induced Depression, it is actually rising. In terms of the General Governemtn Balance (the Maastricht definition of the deficit) the ESRI forecasts that the deficit will widen to €31.3bn this year, or 19.75% of GDP. That's up from €13.2bn as recently as 2008, and a small surplus in 2007.
The ESRI does say it expects the deficit to fall in 2011. There is an assumption that there will be no further bank bailouts, so the the 'underlying deficit' will decline from 11.5% of GDP to 10.5%. However, this last forecast is premised on the idea that a 'full package of €3bn in austerity measures' is implemented in full.
But we have been here before with the ESRI. They assumed as much in the Spring 2009 Report, argung for the full implementation of €4bn spending cuts and tax increases, plus €750mn in capital spending cuts. And what was the verdict? If we take only the Exchequer budget balance, leaving aside all the bailouts, the ESRI assumed then that the deficits would be €25.7bn and €19.3bn in 2009 and 2010 respectively. The oututurn and forecast for those two years is now estmated and forecast by the ESRI to be ¤24.6bn and ¤17.6bn respectively. That is a 'saving' of €1.1bn and €1.7bn, versus total Budget measures equivalent to €17.6bn once this year's measures are included (which ESRI does). It only 'works' at all because of resumed mass emigration lightening the welfare bill, at a cost of the long-term capacity of the economy and an increased dependency age of its poplation.
And the stock of debt keeps rising as the deficit remains stubbornly high, interestpayments mount and the GDP denominator declines, from 25.1% in 2007 to a forecast of 93.5% in 2011.
Investment
The main problem in the economy remains the slump in investment. Gross fixed capital formation has fallen by €31.7bn from its peak. This accounts for more than either the decline in GDP or GNP during the recession. It is down for 12 consecutive quarters, falling again in Q1, down 30% from Q1 2009. The ESRI is forecasting that it will fall by a further 24% in 2010 (p.10, Table A). This would leave investment at just 12.5% of GDP. By comparison, even with the slump in investment elsewhere, the OECD average investment rate in Q4 2009 was 18.4% of GDP, and is expected to pick up somewhat later in the course of this year. At this rate, the genuine MNCs based here might have to reconsider their position.
If the ruling ideology bore any relation to reality, this could not be happening. 'Expansonary Fiscal Contractions', 'crowding in' and similar nonsense are premised on the idea that, as government withdraws from economic activity, the private sector would fill the gap, and more efficiently. It is doing neither. It is further argued that cutting government spending, both current spending and capital spending will reduce the deficit and the debt. But the decline in the deficit still remains next year's forecast away and the debt continues to climb. Meanwhile hundreds of thousands of Irish women and men are not working.
Neither is policy.
Tuesday, 29 June 2010
More of the same
Michael Burke: There has been much discussion about the ESRI's view that Ireland will eventually recover to have a stronger growth rate than most other EU economies. The interest was sparked because some took it to be a vindication of government policy. But the ESRI forcasts are not exceptional; they're very much in line with those of the OECD, IMF and, in the short-run, the EU Commission.
But neither are they a vindication of government policy.
To take just one of the assessments, that of the IMF, in its recent annual assessmnent of the economy there were lots of encouraging words on policy. 'Assertive', 'credibility', 'resolve', 'appropriately ambitious fiscal consolidation' all get an airing in the first two paragraphs, so you get the picture.
But, just as you wouldn't ask Seamus Heaney for a inflation forecast, no-one ever reads the IMF publications for the beauty of their writing. It's the numbers we care about. Here is a summary of some the key numbers
* GDP falling by 0.5% this year
* A gradual rise in GDP growth to 3.5% in 2015
* Unemployment peaking at 13.5% this year
* But structural unemployment keeping the rate at 9% in 2015
There's one more shocking number to come, but let's deal with these first. The recession here began at the start of 2008, for the Euro Area as a whole it began one year later. The Euro Area began to recover in mid-2009 while all the official foreasts have the economy here contracting again in the first half of this year. Therefore the Irish recession will be precisely two-and-a-half years long, compared to 6 months for the Euro Area as a whole.
The forecast increase in GDP growth to 3.5% provides little cause for celebration. The last time this economy had a lower growth rate than that was in 1993, recovering from the strait-jacket of the European Exchange Rate Mechanism and an overvalued punt. In addtion, as all the forecasts agree, the recovery will be a statistical one only as net exports pick-up on the back of rising global demand (but, incidentally, nailing the nonsense about 'lack of competitiveness').
But, since the export sector relies heavily on foreign imports, because it is not especially labour-intensive and, above all, because it is so lowly-taxed, none of this statistical improvement will be reflected in domestic ativity or create jobs (or narrow the deficit). So, shockingly, unemployment is still expected to be 9% in 2015. And although the IMF does not state it, given that employment prospects are so poor, the declining unemployment rate must arise overwhelmingly from continued mass emigration.
This might be of little concern to the IMF, which states that "[Government] actions have reassured the global policy community and international financial markets." We won't dwell on the fact that Irish 10yr government bond yields were 5.6% yesterday, having started the crisis at 4.1%, nor that most other yields have fallen since that time. But at least the 'global policy community' is reassured, by which the IMF means, well, the IMF and others.
Yet the only other number of significance is the most shocking of all. The IMF arguments that prior measures are on a track 'leading towards' deficit-reduction. But not on the track itself, as they argue for further fiscal consolidation measures equivalent to 4.5% of GDP. And, if growth is not as robust as the government foecasts 'a clear possibility' the IMF says, the measures will need to be even larger.
To put this in context, the €3bn in further measures the government is talking about is 1.8% of GDP, on top of the 2008 ad 2009 budgets, emergency budget and measures which amounted to 8.9% of GDP. So, rather than the government's €3bn measures, the IMF reckons they should be at least €7.35bn, probably more. That's at least half the fiscal tightening already seen to date.
It is to repeat a fiscal tightening which led to wider, not norrower deficits (7.3% of GDP to 14.3%),and the longest, deepest recession in the Euro Area, as well as a surge in both unemployment and emigration. Repeating the same experiment and expecting a different outcome is madness.
But neither are they a vindication of government policy.
To take just one of the assessments, that of the IMF, in its recent annual assessmnent of the economy there were lots of encouraging words on policy. 'Assertive', 'credibility', 'resolve', 'appropriately ambitious fiscal consolidation' all get an airing in the first two paragraphs, so you get the picture.
But, just as you wouldn't ask Seamus Heaney for a inflation forecast, no-one ever reads the IMF publications for the beauty of their writing. It's the numbers we care about. Here is a summary of some the key numbers
* GDP falling by 0.5% this year
* A gradual rise in GDP growth to 3.5% in 2015
* Unemployment peaking at 13.5% this year
* But structural unemployment keeping the rate at 9% in 2015
There's one more shocking number to come, but let's deal with these first. The recession here began at the start of 2008, for the Euro Area as a whole it began one year later. The Euro Area began to recover in mid-2009 while all the official foreasts have the economy here contracting again in the first half of this year. Therefore the Irish recession will be precisely two-and-a-half years long, compared to 6 months for the Euro Area as a whole.
The forecast increase in GDP growth to 3.5% provides little cause for celebration. The last time this economy had a lower growth rate than that was in 1993, recovering from the strait-jacket of the European Exchange Rate Mechanism and an overvalued punt. In addtion, as all the forecasts agree, the recovery will be a statistical one only as net exports pick-up on the back of rising global demand (but, incidentally, nailing the nonsense about 'lack of competitiveness').
But, since the export sector relies heavily on foreign imports, because it is not especially labour-intensive and, above all, because it is so lowly-taxed, none of this statistical improvement will be reflected in domestic ativity or create jobs (or narrow the deficit). So, shockingly, unemployment is still expected to be 9% in 2015. And although the IMF does not state it, given that employment prospects are so poor, the declining unemployment rate must arise overwhelmingly from continued mass emigration.
This might be of little concern to the IMF, which states that "[Government] actions have reassured the global policy community and international financial markets." We won't dwell on the fact that Irish 10yr government bond yields were 5.6% yesterday, having started the crisis at 4.1%, nor that most other yields have fallen since that time. But at least the 'global policy community' is reassured, by which the IMF means, well, the IMF and others.
Yet the only other number of significance is the most shocking of all. The IMF arguments that prior measures are on a track 'leading towards' deficit-reduction. But not on the track itself, as they argue for further fiscal consolidation measures equivalent to 4.5% of GDP. And, if growth is not as robust as the government foecasts 'a clear possibility' the IMF says, the measures will need to be even larger.
To put this in context, the €3bn in further measures the government is talking about is 1.8% of GDP, on top of the 2008 ad 2009 budgets, emergency budget and measures which amounted to 8.9% of GDP. So, rather than the government's €3bn measures, the IMF reckons they should be at least €7.35bn, probably more. That's at least half the fiscal tightening already seen to date.
It is to repeat a fiscal tightening which led to wider, not norrower deficits (7.3% of GDP to 14.3%),and the longest, deepest recession in the Euro Area, as well as a surge in both unemployment and emigration. Repeating the same experiment and expecting a different outcome is madness.
Wednesday, 14 April 2010
ESRI commentary
Paul Sweeney: In his latest book, “Freefall: America, Free Markets, and the Sinking of the World Economy,” Joseph Stiglitz slams the Irish government’s attitude to international cooperation on dealing with the financial crisis. He quotes disgraced former Minister Willie O’Dea, who boasted that Ireland can be a free-rider on the back of other economies’ stimulus packages.
The book, as its title indicates, is a fierce attack on how the adherents of free market economics brought the global economy to its knees. Stiglitz is scathingly critical of the conservative (free market) view and argues that it is far better to raise taxes on those who can afford them than cutting expenditure and welfare in a depression.
It is again deeply disappointing that an august body like the ESRI continues to devalue its otherwise excellent analysis and research by equating wage movements with “competitiveness.” A cursory glance at the reports issued by the National Competitiveness Council would demonstrate that the issue of competitiveness is far more complex than wage movements. (See for example, the NCC’s Benchmarking Ireland’s Performance, posted below, where wage costs, unit labour costs, etc. are compared and not found to be as vital as some would have us believe, p59-63).
A clear understating of the complex issue of competitiveness is vital if we are to get ourselves out of this deep hole.
It is also deeply disappointing - and perhaps disingenuous - that the ESRI and many other conservative economic commentators, who are “wage movement obsessives,” neglect to look at comparative international labour costs. Could this be because Ireland, in spite of rises in recent years, is still down the list on total labour costs? And what about Irish productivity? Not booming in recent years, but still high.
The ESRI has been quite obsessive about falling wages in the private sector. In its latest report, it admits that “there was no conclusive evidence of falls in hourly earnings in the private sector.” Yet it desperately wants such cuts in wages – to fit in with its crude wages=competitiveness model. In spite of the evidence to date, it then predicts “our expectation is now that wages across the economy will have fallen by 2 per cent in 2009 and that they will fall by 3 per cent in 2010 and by a further 1 per cent in 2011.” However, this will be due largely to the imposed cuts in public sector earnings and reduced working hours all over the private sector. They got it wrong so far on wages in the private sector, and maybe they will be wrong again on this projection.
In fairness to John Fitzgerald of the ESRI, some time ago he said that the justification for the cuts in public sector wages then being mooted in Government was weakened by the fact that private sector earnings (per hour - the way to evaluate such movements) had not fallen. This is still the case.
The ESRI says that “our forecasts suggest that labour’s share of GNP will fall from 54.6 per cent in 2009 to 50½ per cent in 2011. This demonstrates that we are optimistic with respect to the competitiveness challenge which built up in the years leading up to the economic collapse.”
This fall in labour’s share of national income, of course, means a greater share for capital, including the banks. What is interesting is the simplistic tie-in of falling workers’ incomes with improved “competitiveness”. Why would one be so “optimistic” when the fall in wages will further reduce plummeting domestic demand and, thus, employment?
The ESRI report itself shows how consumption fell by 7.2% in 2009, and while they hope it will fall by only 1 per cent this year, they seem to be doing their best to cheer on a greater reduction engendered by pro-cyclical, deflationary polices.
Today’s retail figures are not good when one strips out the state subsidies to car buyers. The fall is a substantial -6.8% in the year, up from under -3% in 2008.
Investment, they also tell us, collapsed by a staggering 30% last year, and they take comfort in that it will only fall by a massive (is that smaller than staggering?) 20% in volume terms this year. Imports have fallen so much - due to reduced earnings and increasing joblessness - that the balance of payments is improving substantially. This is also aided by the very strong performance of Irish exports (why have exports done so well, if Irish wages are so high?). With no jobs policies, a quarter of a million more people (244,000 per ESRI) will be out of work at the end of this year than just two years ago. Thus, demand will fall further. Why is the deflationary impact of government policies not seriously considered by the ESRI?
Yet if one reads the report, one can see that the collapse in the banks, (the ESRI’s own figure is a gross cost of €73bn in taxpayer bailout) and and the fact banks are still not lending to small businesses etc., are the real issues hitting competitiveness.
Perhaps the ESRI should be more precise in its use of English and talk of “wage competiveness”. It should perhaps really be “wage movements”, if one is not including productivity and the impact of exchange rate movements. This is a much more precise definition - more accurate and informative. But perhaps less ideological?
The ESRI commentary admits it got it seriously wrong on the cost of the public bailout of the banks. “The revelations in respect of the scale of losses in Anglo Irish Bank and the consequent needs for recapitalisation were well beyond anything that we, like many others, (but not all) had anticipated.”
It predicts that the net cost of the bank bailout will cost Irish workers and other taxpayers a staggering €25bn. This is 80% of this year’s total tax receipts of €32bn. And it could be much more. This is what is really hitting our competitiveness in my opinion! Why is this issue dominating media? Because it is the key economic issue. Not wage movements.
The optimism regarding a hoped-for recovery of 2 or 3 per cent growth next year pales significantly when one realises that the Irish economy will be a huge one-fifth (20 per cent) smaller (GNP) this year than at its peak in 2007.
The book, as its title indicates, is a fierce attack on how the adherents of free market economics brought the global economy to its knees. Stiglitz is scathingly critical of the conservative (free market) view and argues that it is far better to raise taxes on those who can afford them than cutting expenditure and welfare in a depression.
It is again deeply disappointing that an august body like the ESRI continues to devalue its otherwise excellent analysis and research by equating wage movements with “competitiveness.” A cursory glance at the reports issued by the National Competitiveness Council would demonstrate that the issue of competitiveness is far more complex than wage movements. (See for example, the NCC’s Benchmarking Ireland’s Performance, posted below, where wage costs, unit labour costs, etc. are compared and not found to be as vital as some would have us believe, p59-63).
A clear understating of the complex issue of competitiveness is vital if we are to get ourselves out of this deep hole.
It is also deeply disappointing - and perhaps disingenuous - that the ESRI and many other conservative economic commentators, who are “wage movement obsessives,” neglect to look at comparative international labour costs. Could this be because Ireland, in spite of rises in recent years, is still down the list on total labour costs? And what about Irish productivity? Not booming in recent years, but still high.
The ESRI has been quite obsessive about falling wages in the private sector. In its latest report, it admits that “there was no conclusive evidence of falls in hourly earnings in the private sector.” Yet it desperately wants such cuts in wages – to fit in with its crude wages=competitiveness model. In spite of the evidence to date, it then predicts “our expectation is now that wages across the economy will have fallen by 2 per cent in 2009 and that they will fall by 3 per cent in 2010 and by a further 1 per cent in 2011.” However, this will be due largely to the imposed cuts in public sector earnings and reduced working hours all over the private sector. They got it wrong so far on wages in the private sector, and maybe they will be wrong again on this projection.
In fairness to John Fitzgerald of the ESRI, some time ago he said that the justification for the cuts in public sector wages then being mooted in Government was weakened by the fact that private sector earnings (per hour - the way to evaluate such movements) had not fallen. This is still the case.
The ESRI says that “our forecasts suggest that labour’s share of GNP will fall from 54.6 per cent in 2009 to 50½ per cent in 2011. This demonstrates that we are optimistic with respect to the competitiveness challenge which built up in the years leading up to the economic collapse.”
This fall in labour’s share of national income, of course, means a greater share for capital, including the banks. What is interesting is the simplistic tie-in of falling workers’ incomes with improved “competitiveness”. Why would one be so “optimistic” when the fall in wages will further reduce plummeting domestic demand and, thus, employment?
The ESRI report itself shows how consumption fell by 7.2% in 2009, and while they hope it will fall by only 1 per cent this year, they seem to be doing their best to cheer on a greater reduction engendered by pro-cyclical, deflationary polices.
Today’s retail figures are not good when one strips out the state subsidies to car buyers. The fall is a substantial -6.8% in the year, up from under -3% in 2008.
Investment, they also tell us, collapsed by a staggering 30% last year, and they take comfort in that it will only fall by a massive (is that smaller than staggering?) 20% in volume terms this year. Imports have fallen so much - due to reduced earnings and increasing joblessness - that the balance of payments is improving substantially. This is also aided by the very strong performance of Irish exports (why have exports done so well, if Irish wages are so high?). With no jobs policies, a quarter of a million more people (244,000 per ESRI) will be out of work at the end of this year than just two years ago. Thus, demand will fall further. Why is the deflationary impact of government policies not seriously considered by the ESRI?
Yet if one reads the report, one can see that the collapse in the banks, (the ESRI’s own figure is a gross cost of €73bn in taxpayer bailout) and and the fact banks are still not lending to small businesses etc., are the real issues hitting competitiveness.
Perhaps the ESRI should be more precise in its use of English and talk of “wage competiveness”. It should perhaps really be “wage movements”, if one is not including productivity and the impact of exchange rate movements. This is a much more precise definition - more accurate and informative. But perhaps less ideological?
The ESRI commentary admits it got it seriously wrong on the cost of the public bailout of the banks. “The revelations in respect of the scale of losses in Anglo Irish Bank and the consequent needs for recapitalisation were well beyond anything that we, like many others, (but not all) had anticipated.”
It predicts that the net cost of the bank bailout will cost Irish workers and other taxpayers a staggering €25bn. This is 80% of this year’s total tax receipts of €32bn. And it could be much more. This is what is really hitting our competitiveness in my opinion! Why is this issue dominating media? Because it is the key economic issue. Not wage movements.
The optimism regarding a hoped-for recovery of 2 or 3 per cent growth next year pales significantly when one realises that the Irish economy will be a huge one-fifth (20 per cent) smaller (GNP) this year than at its peak in 2007.
Friday, 5 February 2010
Uno duce, una voce
Nat O'Connor: I cannot allow two recent stories in the papers to go by without comment.
Today's Irish Independent reports (in a story about Enda Kenny) that "Brian Cowen's handlers are issuing instructions to the media about what questions the Taoiseach can be asked."
The report goes on to say:
"Mr Cowen is objecting to being questioned about national issues when he travels around the country.
"In an unprecedented move, the Fianna Fail press office yesterday issued a schedule for Mr Cowen's trip to Cork this afternoon with the instruction 'the Taoiseach will only take questions related to his visit to Cork'.
"Mr Cowen's spokesman said the Taoiseach would rather focus on the topics he is dealing with on the trip."
In a democracy, and not only during an unprecedented national crisis, it is the right of citizens and journalists to ask the Taoiseach any question that they believe to be of public interest.
Meanwhile, a controversy rages between the Minister for the Environment, Heritage and Local Government and the ESRI. In particular, the Minister is quoted as saying:
"I do regret that they have been drawn into what is clearly a public relations campaign on behalf of Dublin City Council and Covanta and it is no coincidence that the report was released today and it is simply to undermine Government waste policy,”, and
“Certainly in my time in public life, I’ve never come across anything like this where ESRI is used in that way and I think they departed from their normal standards in that regard,”
It is welcome that the Minister's consultants (Eunomia) should argue with the ESRI about the method used, the data included, etc. That's healthy. Many people on this blog also argue with the ESRI about methods and data.
But for the Minister to accuse the ESRI of public relations campaigning for Dublin City Council and "departure from professional standards" undermines the role of evidence in informing policy-making. That doesn't just undermine the ESRI, it undermines any organisation that presents evidence and reasoned arguments for or against policy, particularly when the issues are complex, and different theories and models can be used.
If the Taoiseach is not to be questionned and the Minister for the Environment is not to be disagreed with, what next? Uno duce, una voce?
Today's Irish Independent reports (in a story about Enda Kenny) that "Brian Cowen's handlers are issuing instructions to the media about what questions the Taoiseach can be asked."
The report goes on to say:
"Mr Cowen is objecting to being questioned about national issues when he travels around the country.
"In an unprecedented move, the Fianna Fail press office yesterday issued a schedule for Mr Cowen's trip to Cork this afternoon with the instruction 'the Taoiseach will only take questions related to his visit to Cork'.
"Mr Cowen's spokesman said the Taoiseach would rather focus on the topics he is dealing with on the trip."
In a democracy, and not only during an unprecedented national crisis, it is the right of citizens and journalists to ask the Taoiseach any question that they believe to be of public interest.
Meanwhile, a controversy rages between the Minister for the Environment, Heritage and Local Government and the ESRI. In particular, the Minister is quoted as saying:
"I do regret that they have been drawn into what is clearly a public relations campaign on behalf of Dublin City Council and Covanta and it is no coincidence that the report was released today and it is simply to undermine Government waste policy,”, and
“Certainly in my time in public life, I’ve never come across anything like this where ESRI is used in that way and I think they departed from their normal standards in that regard,”
It is welcome that the Minister's consultants (Eunomia) should argue with the ESRI about the method used, the data included, etc. That's healthy. Many people on this blog also argue with the ESRI about methods and data.
But for the Minister to accuse the ESRI of public relations campaigning for Dublin City Council and "departure from professional standards" undermines the role of evidence in informing policy-making. That doesn't just undermine the ESRI, it undermines any organisation that presents evidence and reasoned arguments for or against policy, particularly when the issues are complex, and different theories and models can be used.
If the Taoiseach is not to be questionned and the Minister for the Environment is not to be disagreed with, what next? Uno duce, una voce?
Thursday, 21 January 2010
Who really took the hit in Budget 2010?
Slí Eile: Once upon a time there was a thing called ‘poverty proofing’. And there used to be Agencies (State ones) that specialised in looking at ‘poverty’ (and not just inclusion or equality or human rights although some of these things are not quite a la mode anymore). We have not heard a lot about poverty or poverty-proofing in recent times. If anyone has seen or heard about ‘poverty’ in the recent deluge of official reports and 2010 Budget official documentation they might post a link and reference.
However, the poor know all about it and so do the many organisations working to deal directly with people who are poor either by way of direction financial and human help See www.svp.ie or by way of advocacy and policy research (SVP, The Poor Can’t Pay or Social Justice Ireland and others)
One way to examine poverty is to assemble some statistics about it. There are, now, more official indicators and statistics than ever about poverty – relative, absolute, consistent etc and the information is available internationally from agencies like Eurostat, OECD, UNDP etc. One of the difficulties with statistics is that that’s all they are – things that stand. Or is that so? The Etymology is interesting. The German term is Statistik given as ‘study of political facts and figures’, or the New Latin term is statisticus which is derived from Latin status state
Now if statistics is the ‘study of political facts and figures’ there are three types of ‘facts and statistics’
* Awkward known facts and statistics (from the point of view whichever values-based or ideology-based argument one is trying to advance)
* Convenient facts and statistics (from the point of view…ditto)
* Unknown facts and statistics (which one would love to know but which by definition are unknowable either temporarily or permanently and which could be awkward or convenient depending on their place a larger narrative)
Government spin aided by some researchers who should know better is simply that:
A Prices are falling so people are no worse off in real terms; and
B Irish social welfare rates are high by comparison with other countries
C In light of A and B above, any cuts are not going to entail that much hardship.
A is misleading because, for the basket of goods bought by poorer households, prices are dropping less than for all consumer prices taken together including mortgages. B is simply not true. Take out the UK and we are average to below average among the EU15. Previous posts on this website have explored the international comparative data. See here for example.
To wrap up the spin, some are lumping together two Budgets in succession to discover that Budgets 2009 and 2010 together were in some way ‘progressive’ (Budget 2010 took back some windfall gains for SW recipients in Budget 2009 due to unanticipated price deflation).
And now I am going to explore some issues by reference to the following media headline on page 1 of the Irish Times in December:
“Higher earners hit hardest by recent budgets, claims ESRI” was the headline on 23 December. Really? It depends on the data and it depends on which rung of the ladder you are standing on as you peer downwards into the choppy waters. That ‘we should all tighten our belts’ has dramatically different implications for someone who takes a hit of X amount equal to Y percent while standing on an income of Z. That equal removal of children’s allowance for over 16s for the coming summer months can make a mighty difference to someone on half the industrial wage and someone on 5 times the average industrial wage.
The claim was put forward by the ESRI in their Winter 2009 Quarterly Economic Commentary QEC (for a summary see here). They wrote:
‘while Budget 2010 was clearly regressive, the combination of Budgets 2009 and 2010 placed most of the burden of fiscal adjustment on higher earners’
In a very short piece by Callan, Kean and Walsh (‘Distributional Impact of Tax and Welfare Policy Changes’) which is in the full QEC and is not available to non-subscribers the researchers asses the impact of Budgets 2009 and 2010 against ‘a neutral benchmark’ What is this neutral benchmark? It is crude, to say the least. The ESRI have assumed a fall of 2.5% in nominal wages in 2010 (see first summary table in Overview) and compare changes in income for different households divided into five income groups from lowest to highest. Figure A in Box 2 (Page 24) shows a fall of 4% in income for the lowest income group compared to an increase of roughly 1% for each of the other 4 groups. These estimates refer to income units in terms of family units. In other words, income is equivalised in the following way (‘Income Tax and Welfare Policies: Some current issues'):
Family units are ranked by income, adjusting for differences in family size and composition using a simple equivalence scale: 1 for the first adult in the family, 0.66 for a second adult and 0.33 for children.
As the ESRI authors point out, ‘Much of this effect is driven by the very sharp reductions in Job Seeker’s Allowance for those aged under 25.’ Alternatively, the ESRI present the data according to household units. Here, the comparison by income group shows a much smaller drop for the lowest income group (1.5%) and modest gains for all other groups. In comparing on the basis of a households, a household consisting of one member – say a pensioner is treated the same as a household with 2 adults and 3 children.
The ESRI authors also concede (in a separate place here) that:
It is difficult to assess the scale of impact of Budget 2010 on specific groups since many of the policy changes entail shifts within particular groups. Hence, for example, cuts in job seekers allowances impact more on new applicants and the withdrawal of early childcare supplement for all children under 5 with its replacement by a new scheme for young children in the 3-4 age-group.
No allowance was made for the impact of public sector pay cuts (per QEC document)
This latter point is significant because a low-paid worker in the public sector (yes, they are many) had taken an additional hit over and above the other adjustments used in the ESRI calculations. This effects particular groups of public sector workers more than others and needs to be taken into consideration.
So much for Budget 2010.
The ESRI then show a graph for the impacts of Budget 2009 (Figure B on page 25) benchmarking on a 3.5% fall in nominal wages in 2009. Here the pattern is reversed somewhat compared to Budget 2010 – high income earners take the biggest hit at 6% (reflecting among other things income and levies) while the low income households take a lower reduction (or an increase if household composition is taken into account). The income group second from the bottom see an increase in income against the benchmark. Recall that most basic social welfare rates were increased by 3% in Budget 2009 (although other payments were reduced including the Christmas bonus and various discretionary payments and allowances were curtailed in the 2009 Budget).
Having found –according to these estimates and this modelling – that Budget 2010 was ‘regressive’ and Budget 2009 was ‘progressive’ what did the ESRI do? You have guessed. They lumped the impacts together to estimate a ‘Combined Distributional Impact of Budgets 2009 and Budget 2010 versus Wage Indexation (-3.5%)’ and hey presto: the rich were soaked and the poor were less soaked when both budgets are brought into play. Alas, I am a dreadful sceptic refusing to believe the ‘facts’ and sniffing spin somewhere. What about the following:
Supposing the rich took a 10% cut – on average – in 2009 (quite possibly as various types of incomes on assets and employment took a dramatic hammering in the downturn) and the poor took a 5% cut – are we comparing like with like in terms of hardship, health and psychological trauma? Is the tipping point different for someone who is already insecure, anxious and worried that a breakdown in some appliance simply cannot lead to replacement anymore?
Exactly which types of income are taken into account in this model? Do we know anything about those parts of income that are completely or partially outside the tax net? (undeclared income, tax-free income, profits accruing to those companies least hit by the recession?
As the old saying goes
‘First get your facts, then you can distort them at your leisure’! I am not suggesting that the ESRI or other economic commentators have been doing this. However, some folks in the media and the political world are – for their own purposes and researchers and other independent commentators should be careful about how their findings and facts are picked up somewhere else
The Poor Can’t Pay document states:
Government said it had to make difficult decisions. But the decisions now facing many of Ireland’s poorest households will be much more difficult. How can I feed my family tonight? Can we afford to heat the house? Which bill can I pay this week, and which must I hope can be postponed? How will we manage when the bills cannot be postponed any longer?
Based on CSO EU SILC data, the three groups in relative poverty are, in descending order:
Lone parents (36%)
Couples with 3 children (25%)
Others with children (16%)
In other words, working age households with children. These are the groups most heavily targetted in Budget 2010. This is also confirmed in the early post-budget analysis by Social Justice Ireland (refer to Chart 6.1 in the analysis here).
Following an examinations of the Budget 2010, the ‘Poor can’t pay’ research document gives details of how various individuals and family types are affected with reference to concrete examples:
Case Study 1: Unemployed lone parent
Case Study 2: Student about to graduate
Case Study 3: A person claiming the Blind Pension
Case Study 4: A carer for a person with a disability, with an unemployed son
Case Study 5: An unemployed couple with children
Case Study 6: A working lone parent
Case Study 7: A family managing on unemployment and part-time work
How many bankers, senior civil servants, academic and stockbroker economists have a clue what it is really like to live in any of the above real situations? Lets get real.
However, the poor know all about it and so do the many organisations working to deal directly with people who are poor either by way of direction financial and human help See www.svp.ie or by way of advocacy and policy research (SVP, The Poor Can’t Pay or Social Justice Ireland and others)
One way to examine poverty is to assemble some statistics about it. There are, now, more official indicators and statistics than ever about poverty – relative, absolute, consistent etc and the information is available internationally from agencies like Eurostat, OECD, UNDP etc. One of the difficulties with statistics is that that’s all they are – things that stand. Or is that so? The Etymology is interesting. The German term is Statistik given as ‘study of political facts and figures’, or the New Latin term is statisticus which is derived from Latin status state
Now if statistics is the ‘study of political facts and figures’ there are three types of ‘facts and statistics’
* Awkward known facts and statistics (from the point of view whichever values-based or ideology-based argument one is trying to advance)
* Convenient facts and statistics (from the point of view…ditto)
* Unknown facts and statistics (which one would love to know but which by definition are unknowable either temporarily or permanently and which could be awkward or convenient depending on their place a larger narrative)
Government spin aided by some researchers who should know better is simply that:
A Prices are falling so people are no worse off in real terms; and
B Irish social welfare rates are high by comparison with other countries
C In light of A and B above, any cuts are not going to entail that much hardship.
A is misleading because, for the basket of goods bought by poorer households, prices are dropping less than for all consumer prices taken together including mortgages. B is simply not true. Take out the UK and we are average to below average among the EU15. Previous posts on this website have explored the international comparative data. See here for example.
To wrap up the spin, some are lumping together two Budgets in succession to discover that Budgets 2009 and 2010 together were in some way ‘progressive’ (Budget 2010 took back some windfall gains for SW recipients in Budget 2009 due to unanticipated price deflation).
And now I am going to explore some issues by reference to the following media headline on page 1 of the Irish Times in December:
“Higher earners hit hardest by recent budgets, claims ESRI” was the headline on 23 December. Really? It depends on the data and it depends on which rung of the ladder you are standing on as you peer downwards into the choppy waters. That ‘we should all tighten our belts’ has dramatically different implications for someone who takes a hit of X amount equal to Y percent while standing on an income of Z. That equal removal of children’s allowance for over 16s for the coming summer months can make a mighty difference to someone on half the industrial wage and someone on 5 times the average industrial wage.
The claim was put forward by the ESRI in their Winter 2009 Quarterly Economic Commentary QEC (for a summary see here). They wrote:
‘while Budget 2010 was clearly regressive, the combination of Budgets 2009 and 2010 placed most of the burden of fiscal adjustment on higher earners’
In a very short piece by Callan, Kean and Walsh (‘Distributional Impact of Tax and Welfare Policy Changes’) which is in the full QEC and is not available to non-subscribers the researchers asses the impact of Budgets 2009 and 2010 against ‘a neutral benchmark’ What is this neutral benchmark? It is crude, to say the least. The ESRI have assumed a fall of 2.5% in nominal wages in 2010 (see first summary table in Overview) and compare changes in income for different households divided into five income groups from lowest to highest. Figure A in Box 2 (Page 24) shows a fall of 4% in income for the lowest income group compared to an increase of roughly 1% for each of the other 4 groups. These estimates refer to income units in terms of family units. In other words, income is equivalised in the following way (‘Income Tax and Welfare Policies: Some current issues'):
Family units are ranked by income, adjusting for differences in family size and composition using a simple equivalence scale: 1 for the first adult in the family, 0.66 for a second adult and 0.33 for children.
As the ESRI authors point out, ‘Much of this effect is driven by the very sharp reductions in Job Seeker’s Allowance for those aged under 25.’ Alternatively, the ESRI present the data according to household units. Here, the comparison by income group shows a much smaller drop for the lowest income group (1.5%) and modest gains for all other groups. In comparing on the basis of a households, a household consisting of one member – say a pensioner is treated the same as a household with 2 adults and 3 children.
The ESRI authors also concede (in a separate place here) that:
It is difficult to assess the scale of impact of Budget 2010 on specific groups since many of the policy changes entail shifts within particular groups. Hence, for example, cuts in job seekers allowances impact more on new applicants and the withdrawal of early childcare supplement for all children under 5 with its replacement by a new scheme for young children in the 3-4 age-group.
No allowance was made for the impact of public sector pay cuts (per QEC document)
This latter point is significant because a low-paid worker in the public sector (yes, they are many) had taken an additional hit over and above the other adjustments used in the ESRI calculations. This effects particular groups of public sector workers more than others and needs to be taken into consideration.
So much for Budget 2010.
The ESRI then show a graph for the impacts of Budget 2009 (Figure B on page 25) benchmarking on a 3.5% fall in nominal wages in 2009. Here the pattern is reversed somewhat compared to Budget 2010 – high income earners take the biggest hit at 6% (reflecting among other things income and levies) while the low income households take a lower reduction (or an increase if household composition is taken into account). The income group second from the bottom see an increase in income against the benchmark. Recall that most basic social welfare rates were increased by 3% in Budget 2009 (although other payments were reduced including the Christmas bonus and various discretionary payments and allowances were curtailed in the 2009 Budget).
Having found –according to these estimates and this modelling – that Budget 2010 was ‘regressive’ and Budget 2009 was ‘progressive’ what did the ESRI do? You have guessed. They lumped the impacts together to estimate a ‘Combined Distributional Impact of Budgets 2009 and Budget 2010 versus Wage Indexation (-3.5%)’ and hey presto: the rich were soaked and the poor were less soaked when both budgets are brought into play. Alas, I am a dreadful sceptic refusing to believe the ‘facts’ and sniffing spin somewhere. What about the following:
Supposing the rich took a 10% cut – on average – in 2009 (quite possibly as various types of incomes on assets and employment took a dramatic hammering in the downturn) and the poor took a 5% cut – are we comparing like with like in terms of hardship, health and psychological trauma? Is the tipping point different for someone who is already insecure, anxious and worried that a breakdown in some appliance simply cannot lead to replacement anymore?
Exactly which types of income are taken into account in this model? Do we know anything about those parts of income that are completely or partially outside the tax net? (undeclared income, tax-free income, profits accruing to those companies least hit by the recession?
As the old saying goes
‘First get your facts, then you can distort them at your leisure’! I am not suggesting that the ESRI or other economic commentators have been doing this. However, some folks in the media and the political world are – for their own purposes and researchers and other independent commentators should be careful about how their findings and facts are picked up somewhere else
The Poor Can’t Pay document states:
Government said it had to make difficult decisions. But the decisions now facing many of Ireland’s poorest households will be much more difficult. How can I feed my family tonight? Can we afford to heat the house? Which bill can I pay this week, and which must I hope can be postponed? How will we manage when the bills cannot be postponed any longer?
Based on CSO EU SILC data, the three groups in relative poverty are, in descending order:
Lone parents (36%)
Couples with 3 children (25%)
Others with children (16%)
In other words, working age households with children. These are the groups most heavily targetted in Budget 2010. This is also confirmed in the early post-budget analysis by Social Justice Ireland (refer to Chart 6.1 in the analysis here).
Following an examinations of the Budget 2010, the ‘Poor can’t pay’ research document gives details of how various individuals and family types are affected with reference to concrete examples:
Case Study 1: Unemployed lone parent
Case Study 2: Student about to graduate
Case Study 3: A person claiming the Blind Pension
Case Study 4: A carer for a person with a disability, with an unemployed son
Case Study 5: An unemployed couple with children
Case Study 6: A working lone parent
Case Study 7: A family managing on unemployment and part-time work
How many bankers, senior civil servants, academic and stockbroker economists have a clue what it is really like to live in any of the above real situations? Lets get real.
Wednesday, 28 October 2009
Controversies over speed of fiscal adjustment
Slí Eile: A recent paper by John Fitzgerald of the ESRI (‘Fiscal Policy for Recovery’) indicates the scale of challenge facing public finances in Ireland. His medicine, while conforming to the standard prescription, is greatly more nuanced than the Slash and Burn school of McCarthy/Department of Finance). He outlines six principal Conclusions as follows:
Standard Dublin Consensus Conclusions:
Wages are too high and need to be cut by ‘7% over 3 years’ (in the public and private sectors)
Capital investment should be focussed on producing ‘the maximum impact on the productive capacity of the economy’ but not primarily as generating jobs in the short-run (implicitly the inevitability of continuing high levels of unemployment is accepted pending a larger-scale resumption of outward migration?)
Frontload public spending cuts but in a way that increases efficiency ‘with a minimum impact on services’. ‘Cuts in expenditure now, with an agreed reform package, may well be the only way to achieve long-term reform’. (Fitzgerald rules out a Keynesian stimulus as the scope for borrowing is too constrained by the depth of pro-cyclical squander in the 97-07 period. He also acknowledges that cutting spending and wages will be deflationary and will postpone recovery in 2010 but believes that TINA).
Reform the welfare system to avoid creating ‘poverty traps’ or disincentives to returning to work (when such eventually becomes possible). (This can only mean lower welfare vis-a-vis wages)
Non-Standard Conclusions:
Taxes as a % of GNP should be raised to 45% over a number of years (with an ESRI preference for property and carbon taxes and some shifting in employer PRSI towards employees)
Tax child benefit but no generalised cuts in welfare rates.
Nearly all of the above runs directly contrary to the position taken by the ICTU (see ‘There is Still a Better, Fairer Way’) and by various progressive commentators (see for example
notesonthefront.typepad.com). In essence the disagreement centers on:
* The deflationary impact of pay cuts in general (as against the claim that such cuts will price us back into export markets and boost investor confidence and expectations).
* The need to prioritise job retention and creation through an investment package (as distinct from a lower capital spend suggested by Fitzgerald of around 4% of GNP)
* Prolonging the period of fiscal adjustment (as against a short, sharp snap before the economy bounces back in 2011 or 2012 – hopefully !)
* Defending all families – especially poorer families – in terms of welfare payments and living standards (as against withdrawing net payments to some households and reducing the ‘replacement rate’)
* Raising taxes towards 40-45% more quickly than that envisaged by Fitzgerald.
Fitzgerald makes two further points which should not be overlooked:
Indeed it was remarkable.
On this last point I must concur 110%.
Standard Dublin Consensus Conclusions:
Wages are too high and need to be cut by ‘7% over 3 years’ (in the public and private sectors)
Capital investment should be focussed on producing ‘the maximum impact on the productive capacity of the economy’ but not primarily as generating jobs in the short-run (implicitly the inevitability of continuing high levels of unemployment is accepted pending a larger-scale resumption of outward migration?)
Frontload public spending cuts but in a way that increases efficiency ‘with a minimum impact on services’. ‘Cuts in expenditure now, with an agreed reform package, may well be the only way to achieve long-term reform’. (Fitzgerald rules out a Keynesian stimulus as the scope for borrowing is too constrained by the depth of pro-cyclical squander in the 97-07 period. He also acknowledges that cutting spending and wages will be deflationary and will postpone recovery in 2010 but believes that TINA).
Reform the welfare system to avoid creating ‘poverty traps’ or disincentives to returning to work (when such eventually becomes possible). (This can only mean lower welfare vis-a-vis wages)
Non-Standard Conclusions:
Taxes as a % of GNP should be raised to 45% over a number of years (with an ESRI preference for property and carbon taxes and some shifting in employer PRSI towards employees)
Tax child benefit but no generalised cuts in welfare rates.
Nearly all of the above runs directly contrary to the position taken by the ICTU (see ‘There is Still a Better, Fairer Way’) and by various progressive commentators (see for example
notesonthefront.typepad.com). In essence the disagreement centers on:
* The deflationary impact of pay cuts in general (as against the claim that such cuts will price us back into export markets and boost investor confidence and expectations).
* The need to prioritise job retention and creation through an investment package (as distinct from a lower capital spend suggested by Fitzgerald of around 4% of GNP)
* Prolonging the period of fiscal adjustment (as against a short, sharp snap before the economy bounces back in 2011 or 2012 – hopefully !)
* Defending all families – especially poorer families – in terms of welfare payments and living standards (as against withdrawing net payments to some households and reducing the ‘replacement rate’)
* Raising taxes towards 40-45% more quickly than that envisaged by Fitzgerald.
Fitzgerald makes two further points which should not be overlooked:
My own view is that the 7% public service pay cut in March has made a significant dent in the difference between public and private differentials, while still leaving a substantial public sector premium. The tacit acceptance by the public sector of these cuts was quite a remarkable recognition of the crisis which the economy faces.
Indeed it was remarkable.
Before we can determine the appropriate path of fiscal policy over the next five years we must first decide on what is the long run level of public services that we want. Then the tax level will have to be set at an appropriate level to fund that level of services.
On this last point I must concur 110%.
Tuesday, 22 September 2009
More Talk about Public v Private Pay
The ESRI released a study today showing a gap between public and private pay. And IMPACT have released an objection to it.
But is there anything new in all this?
In many ways, the ESRI paper is academic. It is a twenty-one page report of a statistical comparison of 2003 and 2006 data, which means that it doesn't include recent changes, including further pay awards, but also pay cuts and the pension levy.
IMPACT argues that it doesn't compare 'real jobs'. Certainly, the statistical analysis doesn't seem to include trade union membership as a variable (although it does include 'membership of a professional body'). There is obviously a large different in the private sector between the 'good jobs' in large, unionised firms and the full range of private sector wages.
Are there any recent studies comparing unionised versus non-unionised levels of pay (cutting across the artificial public-private divide)? That would seem to be more pertinent. It also would refocus the question on the right to join a trade union and the right of workers to negotiate good wages. As mentioned before in relation to this issue, low wages lead to increased state expenditure, such as income supports, social housing, etc.
There probably needs to be more attention paid to the differences between managerial pay and other pay. Although there is less of a 'pay gap' at managerial level, because higher grades in the public service received higher awards in order to catch up with managerial pay in the private sector that had soared, that process failed to address the question of whether private sector managerial pay was reasonable in the first place. There probably is much more scope for re-examining managerial wages in the public sector than the broad wages of ordinary public servants - but that would involve a debate about what is a reasonable managerial wage.
The ESRI's figures, presumably from a press release, were trotted out on the radio yesterday. And the argument predictably turned to whether the public service is overpaid. But it is equally the case that workers in the private sector are underpaid, at least in some sectors. Again, it would be nice to see some international figures on this, based on purchasing power parity.
There is no doubt that the state's financial situation is dire, and some radical action will have to be taken in the immediate future. But Vincent Browne argued recently that the country's financial situation is nothing like as bad. There is still plenty of wealth in Ireland. So, it is a pity that the Government seems reluctant to grapple with the need for tax reform - and a large scale broadening of the tax base.
Further cuts in public wages will also surely depress the economy further. And then there are a lot of households who have taken out large mortgages on the basis of an ability to pay them back. Housing costs represent the stubborn bottom line in terms of the pay levels that people need to get by, and undermining people's ability to pay these loans will further weaken the banks.
All of this is to say that we are likely to see another round of arguments about public versus private pay in the media, but it is only part of the bigger picture.
But is there anything new in all this?
In many ways, the ESRI paper is academic. It is a twenty-one page report of a statistical comparison of 2003 and 2006 data, which means that it doesn't include recent changes, including further pay awards, but also pay cuts and the pension levy.
IMPACT argues that it doesn't compare 'real jobs'. Certainly, the statistical analysis doesn't seem to include trade union membership as a variable (although it does include 'membership of a professional body'). There is obviously a large different in the private sector between the 'good jobs' in large, unionised firms and the full range of private sector wages.
Are there any recent studies comparing unionised versus non-unionised levels of pay (cutting across the artificial public-private divide)? That would seem to be more pertinent. It also would refocus the question on the right to join a trade union and the right of workers to negotiate good wages. As mentioned before in relation to this issue, low wages lead to increased state expenditure, such as income supports, social housing, etc.
There probably needs to be more attention paid to the differences between managerial pay and other pay. Although there is less of a 'pay gap' at managerial level, because higher grades in the public service received higher awards in order to catch up with managerial pay in the private sector that had soared, that process failed to address the question of whether private sector managerial pay was reasonable in the first place. There probably is much more scope for re-examining managerial wages in the public sector than the broad wages of ordinary public servants - but that would involve a debate about what is a reasonable managerial wage.
The ESRI's figures, presumably from a press release, were trotted out on the radio yesterday. And the argument predictably turned to whether the public service is overpaid. But it is equally the case that workers in the private sector are underpaid, at least in some sectors. Again, it would be nice to see some international figures on this, based on purchasing power parity.
There is no doubt that the state's financial situation is dire, and some radical action will have to be taken in the immediate future. But Vincent Browne argued recently that the country's financial situation is nothing like as bad. There is still plenty of wealth in Ireland. So, it is a pity that the Government seems reluctant to grapple with the need for tax reform - and a large scale broadening of the tax base.
Further cuts in public wages will also surely depress the economy further. And then there are a lot of households who have taken out large mortgages on the basis of an ability to pay them back. Housing costs represent the stubborn bottom line in terms of the pay levels that people need to get by, and undermining people's ability to pay these loans will further weaken the banks.
All of this is to say that we are likely to see another round of arguments about public versus private pay in the media, but it is only part of the bigger picture.
Monday, 6 July 2009
Cuts and economic activity
Michael Taft: While we await the publication (or, at least, the drawn-out leaking) of the An Bord Snip Nua report, it is well to be reminded of the considerable limitations that public expenditure reductions will have on our fiscal deficit and, so, our borrowing requirement. The ESRI has worked through a number of policy proposals to assess their impact on economic activity. Let’s take three calculations. They assess the following three proposals:
• 5% reduction in public sector wages
• 10% cut in health and education employment
• €1 billion in public investment
Together, these would reduce public expenditure by €3 billion. This is more than the Government hopes to cut next year, and about 66 percent of Bord Snip’s total cuts, as reported in the media. No doubt these are the type and extent of cuts that many commentators have been calling for, claiming that it will considerably improve the Exchequer’s fiscal position. However, the ESRI’s conclusions suggest caution regarding the fiscal effect.
Taking these three policy initiatives together, we find that the domestic economy (GNP) would decline by -1.5 percent, consumption would fall by -1.3 percent, while unemployment would climb by 1 percent. Of course, this doesn’t take into account the impact on the quality– in the case of cutting employment – of our educational and health infrastructure.
So: further economic decline and higher unemployment resulting from these three measures. What would be the impact on the Exchequer fiscal position? Minimal. The ESRI calculates that, taken together, these measures would reduce the Exchequer borrowing requirement by 0.9 percent. To put this in perspective, the ESRI projects the borrowing requirement to be -15.6 per cent this year and -14.7 percent next year.
If taken together, the cumulative impact would be even more severe than their individual effect, as reduction of GNP is piled on reduction. The economy will be in a weaker position to confront ever higher debt. And, while accepting that the ESRI doesn’t do black humour, its warning that ‘if the external environment were to continue to be very difficult such a level of emigration might not materialise resulting in higher unemployment in the medium term’ suggests that the small reduction in the borrowing requirement might be limited even further, arising from higher social welfare costs.
Hopefully, more careful analysis of the economic impact of deflationary measures will enter the public debate. For it is becoming clearer (if it isn’t clear already) that deflating an economy through budget reductions is like running in quicksand. The more you cut, the more you sink – with little to show for in terms of controlling the fiscal deficit.
• 5% reduction in public sector wages
• 10% cut in health and education employment
• €1 billion in public investment
Together, these would reduce public expenditure by €3 billion. This is more than the Government hopes to cut next year, and about 66 percent of Bord Snip’s total cuts, as reported in the media. No doubt these are the type and extent of cuts that many commentators have been calling for, claiming that it will considerably improve the Exchequer’s fiscal position. However, the ESRI’s conclusions suggest caution regarding the fiscal effect.
Taking these three policy initiatives together, we find that the domestic economy (GNP) would decline by -1.5 percent, consumption would fall by -1.3 percent, while unemployment would climb by 1 percent. Of course, this doesn’t take into account the impact on the quality– in the case of cutting employment – of our educational and health infrastructure.
So: further economic decline and higher unemployment resulting from these three measures. What would be the impact on the Exchequer fiscal position? Minimal. The ESRI calculates that, taken together, these measures would reduce the Exchequer borrowing requirement by 0.9 percent. To put this in perspective, the ESRI projects the borrowing requirement to be -15.6 per cent this year and -14.7 percent next year.
If taken together, the cumulative impact would be even more severe than their individual effect, as reduction of GNP is piled on reduction. The economy will be in a weaker position to confront ever higher debt. And, while accepting that the ESRI doesn’t do black humour, its warning that ‘if the external environment were to continue to be very difficult such a level of emigration might not materialise resulting in higher unemployment in the medium term’ suggests that the small reduction in the borrowing requirement might be limited even further, arising from higher social welfare costs.
Hopefully, more careful analysis of the economic impact of deflationary measures will enter the public debate. For it is becoming clearer (if it isn’t clear already) that deflating an economy through budget reductions is like running in quicksand. The more you cut, the more you sink – with little to show for in terms of controlling the fiscal deficit.
Friday, 8 May 2009
The Banking Crisis and the Real Economy
Jim Stewart: Recent reported commentary in the media from the ESRI, drawing an analogy between Zimbabwe and Ireland is unhelpful in terms of analysing the current crisis in Ireland and developing solutions. The recent ESRI report (Spring 2009) in describing the impact of current policies in terms of rising unemployment, falling tax revenues, etc. is very valuable However, forecasting growth rates is in general a very inexact science. Even estimating past growth rates in the case of Ireland is problematic given the large impact of transfer pricing, and profit outflows from, multinational companies can have on measured GNP.
Other commentary within Ireland on the financial and economic crisis has also been exaggerated. Some examples:
1) Nationalising Anglo-Irish Bank would double the national debt. Wrong, because Anglo-Irish bank will be treated as a semi-state company whose debt is excluded in measuring Government debt for EU and other purposes;
2) The ratio of bank liabilities to GNP is 900%. Wrong, because bank liabilities of IFSC companies should be excluded. If excluded one estimate for this ratio is 309% of GDP (Davy Research Feb 17, 2009), but the total amount guaranteed by the State is 230% (€436 billion) of GDP (Annex I to supplementary Budget p. 17).
But more fundamentally some commentators are wrong in assuming certainty for what is uncertain. The overall impression is one of dogma rather than analysis.
2) The ratio of bank liabilities to GNP is 900%. Wrong, because bank liabilities of IFSC companies should be excluded. If excluded one estimate for this ratio is 309% of GDP (Davy Research Feb 17, 2009), but the total amount guaranteed by the State is 230% (€436 billion) of GDP (Annex I to supplementary Budget p. 17).
But more fundamentally some commentators are wrong in assuming certainty for what is uncertain. The overall impression is one of dogma rather than analysis.
Subscribe to:
Posts (Atom)